HTF/CTF High/Low Mitigation with SignalsHTF/CTF High/Low Mitigation with Signals Indicator
Overview
HTF/CTF High/Low Mitigation with Signals (shortened as "H/L Signals+") is an advanced overlay indicator for TradingView, designed to identify and visualize higher timeframe (HTF) and current timeframe (CTF) swing highs/lows, track their mitigation, and generate filtered buy/sell signals using an EMA ribbon trend filter. It incorporates automated trade simulation with risk/reward (RR) visualization, position sizing based on user-defined risk, and a statistics table for performance evaluation. This tool is ideal for multi-timeframe traders focusing on swing trading, breakout strategies, or trend reversals across assets like forex, futures, metals (e.g., XAU/USD, XAG/USD), stocks, or cryptocurrencies.
The "meshup" (mashup) integrates several complementary elements: Multi-timeframe swing level detection (HTF for broader structure, CTF for finer details) with mitigation logic ensures signals align with market structure breaks; an EMA ribbon provides a dynamic trend bias to filter counter-trend trades; risk management automates position sizing and RR calculations for disciplined trading; and built-in backtesting stats offer quick insights into hypothetical performance. This combination reduces noise from isolated indicators—e.g., raw swings can be choppy, EMAs alone lag structure, and manual RR is error-prone—creating a cohesive system for spotting high-probability setups where structure, trend, and risk align. By meshing these, it aims to enhance decision-making in trending or ranging markets, though it's reactive and best used with confirmation. Note: This is a technical tool for educational purposes only; it does not provide financial advice, guarantees of profitability, or trading recommendations. Past performance is not indicative of future results, and users should backtest thoroughly on their specific assets/timeframes, in compliance with TradingView's house rules.
Key Features
• HTF Swing Levels: Detects and draws session highs/lows from a user-selected higher timeframe (e.g., Daily), extends lines until mitigated (by wick or body close), with alerts on mitigation.
• CTF Swing Levels: Identifies local swing highs/lows on the chart timeframe using a pivot candle formation (default 5-candle), with separate limits for unmitigated/mitigated lines.
• EMA Ribbon: A three-EMA system (fast 8, mid 13, slow 21) with gradient fills (green for bullish, red for bearish) to visualize trend strength and filter signals.
• Signal Generation: Buy/sell labels ("BUY"/"SELL") triggered post-mitigation when price aligns with EMA trend (e.g., above slow EMA with stacked bulls for buys).
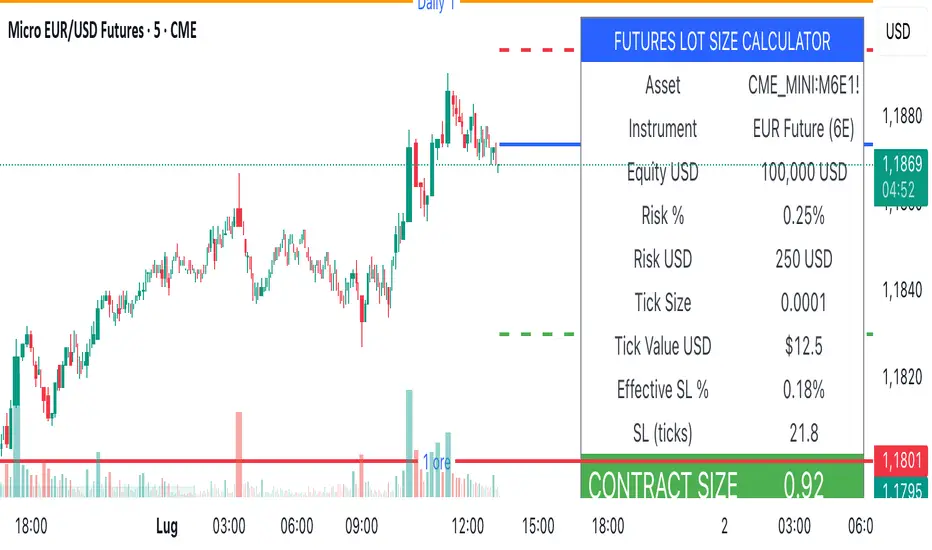
• Trade Simulation & Risk Management: On signals, calculates stop-loss (SL) from recent extremes, position size based on fixed risk amount (e.g., $100 per trade, adjusted for asset type like futures point value or forex lots), and full take-profit (TP) at user-defined RR level (1-5). Draws RR boxes for visuals.
• Statistics Table: Displays total trades, wins/losses, win rate (%), net R-return, and max consecutive losses in a top-right table.
• Alerts: Customizable alerts for HTF mitigations and new trades (including entry, SL, TP, size).
• Visual Customizations: Toggle lines/ribbon/boxes, adjust colors/styles/widths for unmitigated/mitigated lines (HTF/CTF), min box width.
• Performance Optimization: Automatically cleans up excess lines to stay within max limits (e.g., 15 unmitigated HTF, 5 CTF).
How It Works
• HTF Logic: On new HTF bars (via time(htf_timeframe)), captures session high/low and draws extendable lines. Lines extend rightward until mitigated (high/close > high level for highs, low/close < low level for lows, toggle wick/body). Mitigation sets "waiting" flags for signals and triggers alerts.
• CTF Logic: Scans for pivot highs/lows using a user-defined candle count (e.g., 2 left/right for 5-candle swings). Draws and extends lines similarly, mitigating on wick touches, with separate styles for mitigated (e.g., dotted gray).
• EMA Ribbon Logic: Computes 8/13/21 EMAs; fills mid-slow and fast-mid with bullish green (close > slow EMA) or bearish red gradients.
• Signal Conditions: Post-mitigation (waiting_for_buy/sell true), checks EMA stack—buys require close > slow, fast > mid > slow; sells require close < slow, fast < mid < slow. Signals only on confirmed bars.
• Trade Execution: On signal, sets entry at close, scans back to mitigation bar for tightest SL (lowest low for buys, highest high for sells). Calculates risk points (entry - SL for buys), then position size via helper function (asset-specific: e.g., XAU *100, futures *pointvalue, forex 100000pointvalue). Sets full TP at entry ± (risk * full_tp_level). Draws risk/reward boxes (e.g., long: dark risk below entry, blue reward above) with RR and size text. Alerts with trade details.
• Trade Management: Monitors for SL hit (low <= SL for longs) or TP hit (high >= TP for longs); updates stats (wins if TP, losses if SL, tracks consec losses, net R as +full_tp_level or -1). Places summary label ("Hit TP5 (Win)" or "Stopped Out (Loss)").
• Cleanup: Counts unmitigated/mitigated lines; deletes oldest excess to respect max limits (e.g., max_lines_input=15 for HTF unmitigated, max_mit_lines_ctf=5 for CTF mitigated).
• Why This Meshup?: Standalone tools often fall short—HTF swings ignore local noise, but without CTF, miss entries; EMAs filter trends but overlook structure; manual RR lacks automation. Meshing them creates a "mitigation-to-signal" flow: HTF/CTF provide structural context (e.g., BOS/CHOCH), EMA ensures trend alignment (reducing whipsaws), and RR simulation adds practical risk control with stats for optimization. This holistic approach potentially improves edge in structure-based trading, especially in volatile markets, by combining macro/micro analysis with quantifiable risk—though it may lag in ranges or require tuning.
All logic uses arrays for line management, barstate.isconfirmed for reliability, and syminfo for asset-specific sizing. No repainting, but historical trades simulate based on chart data.
Settings and Customization
Inputs are grouped for usability:
1. Higher Timeframe (HTF) Settings:
o Show HTF Lines: Toggle visibility (default: true).
o Use Wick for Mitigation: True for wick touch, false for body close (default: false; tooltip explains).
o Timeframe: HTF period (default: "D").
o Max Unmitigated HTF Lines: Limit for active lines (default: 15, min 1, max 250).
2. Current Timeframe (CTF) Settings:
o Show CTF Swings: Toggle (default: true).
o CTF Swing Candle Count: Left/right candles for pivot (default: 2, min 1; tooltip: '2' = 5-candle formation).
o Max Unmitigated CTF Lines: (default: 5, min 1, max 250).
o Max Mitigated CTF Lines: (default: 5, min 1, max 250).
3. EMA Settings:
o Show EMA Ribbon: Toggle (default: true).
o Fast/Middle/Slow EMA Length: Defaults 8/13/21.
4. Risk/Reward Settings:
o Risk Amount per Trade ($): Fixed risk (default: 100.0, min 0.1; tooltip: for position sizing).
o Full Take Profit Level (1-5): RR for full win (default: 5; tooltip: counts as win in stats).
o Show Trade Visuals & Stats: Toggle boxes, labels, table (default: true).
5. 🎨 Visuals:
o Draw Risk/Reward Box: Toggle (default: true).
o Minimum Box Width (in bars): (default: 5, min 1).
o Long - Risk/Reward Box Colors: Defaults dark gray (risk), blue (reward).
o Short - Risk/Reward Box Colors: Defaults dark gray (risk), orange (reward).
6. Alert Settings:
o Alert on HTF Level Mitigation: Toggle (default: true).
7. HTF Line Style Settings:
o High (Unmitigated): Color (maroon 20%), width (1).
o High (Mitigated): Color (gray 40%), style (dotted/dashed, default dotted).
o Low (Unmitigated): Color (teal 20%), width (1).
o Low (Mitigated): Color (gray 40%), style (dotted/dashed, default dotted).
8. CTF Line Styles:
o CTF High (Unmitigated): Color (purple #8d198d 25%), width (1), style (Solid/Dotted/Dashed, default Solid).
o CTF High (Mitigated): Color (gray 50%), width (1), style (default Dotted).
o CTF Low (Unmitigated): Color (teal #008080 25%), width (1), style (default Solid).
o CTF Low (Mitigated): Color (gray 50%), width (1), style (default Dotted).
Usage Tips
• Multi-Timeframe Strategy: Use HTF (e.g., D1) for major levels, CTF for entries. Signals post-mitigation with EMA filter—enter on "BUY"/"SELL" labels, use boxes for RR visualization.
• Risk Management: Set risk_amount_per_trade to 1-2% of capital; adjust full_tp_level for strategy (e.g., 3 for conservative). Position size auto-adapts to asset (e.g., smaller for high-vol like XAU).
• Customization: Enable wick mitigation for aggressive setups; increase max lines in trending markets. Tune EMAs for asset (shorter for crypto).
• Alerts Integration: Use for notifications on mitigations or trades; messages include all details for quick action.
• Stats Analysis: Table shows hypothetical results—use for optimization (e.g., aim for >50% win rate, low consec losses). Reset on chart reload.
• Chart Compatibility: Best on candlestick charts; test on lower TFs with higher HTF for confluence.
Limitations
• Reactive Signals: Waits for mitigation + EMA alignment, so may miss early reversals or lag in fast markets.
• Chop in Ranges: Frequent mitigations without trend can generate false signals; EMA helps but not foolproof.
• Simulation Only: Trades are backtested on visible data—no live execution; stats assume full TP or SL hits, ignoring partials or slippage.
• Line Limits: Caps at user max to prevent overload; oldest deleted first.
• Asset Specificity: Position sizing tailored to forex/futures/metals; may need tweaks for others.
• Disclaimer: For informational use only. Trading involves risk of loss; results vary by market, timeframe, and settings. Consult professionals and backtest extensively. No profitability claims per TradingView rules.
Search in scripts for "stop loss"

APEX TREND: Macro & Hard Stop SystemAPEX TREND: Macro & Hard Stop System
The APEX TREND System is a composite trend-following strategy engineered to solve the "Whipsaw" problem inherent in standard breakout systems. It orchestrates four distinct technical theories—Macro Trend Filtering, Volatility Squeeze, Momentum, and Volatility Stop-Loss—into a single, hierarchical decision-making engine.
This script is not merely a collection of indicators; it is a rules-based trading system designed for Swing Traders (Day/Week timeframes) who aim to capture major trend extensions while strictly managing downside risk through a "Hard Stop" mechanism.
🧠 Underlying Concepts & Originality
Many trend indicators fail because they treat all price movements equally. The APEX TREND differentiates itself by applying an "Institutional Filter" logic derived from classic Dow Theory and Modern Volatility Analysis.
1. The Macro Hard Stop (The 200 EMA Logic)
Origin: Based on the institutional mandate that “Nothing good happens below the 200-day moving average.”
Function: Unlike standard super trends that flip constantly in sideways markets, this system integrates a 200-period Exponential Moving Average (EMA) as a non-negotiable "Hard Stop."
Synergy: This acts as the primary gatekeeper. Even if the volatility engine signals a "Buy," the system suppresses the signal if the price is below the Macro Baseline, effectively filtering out counter-trend traps.
2. The Volatility Engine (Squeeze Theory)
Origin: Derived from John Carter’s TTM Squeeze concept.
Function: The script identifies periods where Bollinger Bands (Standard Deviation) contract inside Keltner Channels (ATR). This indicates a period of potential energy build-up.
Synergy: The system only triggers an entry when this energy is released (Breakout) AND coincides with Linear Regression Momentum, ensuring the breakout is genuine.
3. Anti-Chop Filter (ADX Integration)
Origin: J. Welles Wilder’s Directional Movement Theory.
Function: A common failure point for trend systems is low-volatility chop. This script utilizes the Average Directional Index (ADX).
Synergy: If the ADX is below the threshold (Default: 20), the market is deemed "Choppy." The script visually represents this by painting candles GRAY, signaling a "No-Trade Zone" regardless of price action.
4. The "Run Trend" Stop Loss (Factor 4.0 ATR)
Origin: Adapted from the Turtle Trading rules regarding volatility-based stops.
Function: Standard Trailing Stops (usually Factor 3.0) are too tight for crypto or volatile equities on daily timeframes.
Optimization: This system employs a wider ATR Multiplier of 4.0. This allows the asset to fluctuate naturally within a trend without triggering a premature exit, maximizing the "Run Trend" potential.
🛠 How It Works (The Algorithm)
The script processes data in a specific order to generate a signal:
Check Macro Trend: Is Price > EMA 200? (If No, Longs are disabled).
Check Volatility: Is ADX > 20? (If No, all signals are disabled).
Check Volume: Is Current Volume > 1.2x Average Volume? (Confirmation of institutional participation).
Trigger: Has a Volatility Breakout occurred in the direction of the Macro Trend?
Execution: If ALL above are true -> Generate Signal.
🎯 Strategy Guide
1. Long Setup (Bullish)
Signal: Look for the Green "APEX LONG" Label.
Condition: The price must be ABOVE the White Line (EMA 200).
Execution: Enter at the close of the signal candle.
Stop Loss: Initial stop at the Green Trailing Line.
2. Short Setup (Bearish)
Signal: Look for the Red "APEX SHORT" Label.
Condition: The price must be BELOW the White Line (EMA 200).
Execution: Enter at the close of the signal candle.
Stop Loss: Initial stop at the Red Trailing Line.
3. Exit Rules (Crucial)
This system employs a Dual-Exit Mechanism:
Soft Exit (Profit Taking): Close the position if the price crosses the Trailing Stop Line (Green/Red line). This locks in profits during a trend reversal.
Hard Exit (Emergency): Close the position IMMEDIATELY if the price crosses the White EMA 200 Line against your trade. This prevents holding a position during a major market regime change.
⚙️ Settings
Momentum Engine: Adjust Bollinger Band/Keltner Channel lengths to tune breakout sensitivity.
Apex Filters: Toggle the EMA 200 or ADX filters on/off to adapt to different asset classes.
Risk Management: The ATR Multiplier (Default 4.0) controls the width of the trailing stop. Lower values = Tighter stops (Scalping); Higher values = Looser stops (Swing).
Disclaimer: This script is designed for trend-following on higher timeframes (4H, 1D, 1W). Please backtest on your specific asset before live trading.

Lorentzian Harmonic Flow - Adaptive ML⚡ LORENTZIAN HARMONIC FLOW — ADAPTIVE ML COMPLETE SYSTEM
THEORETICAL FOUNDATION: TEMPORAL RELATIVITY MEETS MACHINE LEARNING
The Lorentzian Harmonic Flow Adaptive ML system represents a paradigm shift in technical analysis by addressing a fundamental limitation that plagues traditional indicators: they assume time flows uniformly across all market conditions. In reality, markets experience time compression during volatile breakouts and time dilation during consolidation. A 50-period moving average calculated during a quiet overnight session captures vastly different market information than the same calculation during a high-volume news event.
This indicator solves this problem through Lorentzian spacetime modeling , borrowed directly from Einstein's special relativity. By calculating a dynamic gamma factor (γ) that measures market velocity relative to a volatility-based "speed of light," every calculation adapts its effective lookback period to the market's intrinsic clock. Combined with a dual-memory architecture, multi-regime detection, and Bayesian strategy selection, this creates a system that genuinely learns which approaches work in which market conditions.
CRITICAL DISTINCTION: TRUE ADAPTIVE LEARNING VS STATIC CLASSIFICATION
Before diving into the system architecture, it's essential to understand how this indicator fundamentally differs from traditional "Lorentzian" implementations, particularly the well-known Lorentzian Classification indicator.
THE ORIGINAL LORENTZIAN CLASSIFICATION APPROACH:
The pioneering Lorentzian Classification indicator (Jdehorty, 2022) introduced the financial community to Lorentzian distance metrics for pattern matching. However, it used offline training methodology :
• External Training: Required Python scripts or external ML tools to train the model on historical data
• Static Model: Once trained, the model parameters remained fixed
• No Real-Time Learning: The indicator classified patterns but didn't learn from outcomes
• Look-Ahead Bias Risk: Offline training could inadvertently use future data
• Manual Retraining: To adapt to new market conditions, users had to retrain externally and reload parameters
This was groundbreaking for bringing ML concepts to Pine Script, but it wasn't truly adaptive. The model was a snapshot—trained once, deployed, static.
THIS SYSTEM: TRUE ONLINE LEARNING
The Lorentzian Harmonic Flow Adaptive ML system represents a complete architectural departure :
✅ FULLY SELF-CONTAINED:
• Zero External Dependencies: No Python scripts, no external training tools, no data exports
• 100% Pine Script: Entire learning pipeline executes within TradingView
• One-Click Deployment: Load indicator, it begins learning immediately
• No Manual Configuration: System builds its own training data in real-time
✅ GENUINE FORWARD-WALK LEARNING:
• Real-Time Adaptation: Every trade outcome updates the model
• Forward-Only Logic: System uses only past confirmed data—zero look-ahead bias
• Continuous Evolution: Parameters adapt bar-by-bar based on rolling performance
• Regime-Specific Memory: Learns which patterns work in which conditions independently
✅ GETS BETTER WITH TIME:
• Week 1: Bootstrap mode—gathering initial data across regimes
• Month 2-3: Statistical significance emerges, parameter adaptation begins
• Month 4+: Mature learning, regime-specific optimization, confident selection
• Year 2+: Deep pattern library, proven parameter sets, robust to regime shifts
✅ NO RETRAINING REQUIRED:
• Automatic Adaptation: When market structure changes, system detects via performance degradation
• Memory Refresh: Old patterns naturally decay, new patterns replace them
• Parameter Evolution: Thresholds and multipliers adjust to current conditions
• Regime Awareness: If new regime emerges, enters bootstrap mode automatically
THE FUNDAMENTAL DIFFERENCE:
Traditional Lorentzian Classification:
"Here are patterns from the past. Current state matches pattern X, which historically preceded move Y. Signal fired."
→ Static knowledge, fixed rules, periodic retraining required
LHF Adaptive ML:
"In Trending Bull regime, Strategy B has 58% win rate and 1.4 Sharpe over last 30 trades. In High Vol Range, Strategy C performs better with 61% win rate and 1.8 Sharpe. Current state is Trending Bull, so I select Strategy B. If Strategy B starts failing, I'll adapt parameters or switch strategies. I'm learning which patterns matter in which contexts, and I improve every trade."
→ Dynamic learning, contextual adaptation, self-improving system
WHY THIS MATTERS:
Markets are non-stationary. A model trained on 2023 data may fail in 2024 when Fed policy shifts, volatility regime changes, or market structure evolves. Static models require constant human intervention—retraining, re-optimization, parameter updates.
This system learns continuously . It doesn't need you to tell it when markets changed. It discovers regime shifts through performance feedback, adapts parameters accordingly, and rebuilds its pattern library organically. The system running in Month 12 is fundamentally smarter than the system in Month 1—not because you retrained it, but because it learned from 1,000+ real outcomes.
This is the difference between pattern recognition (static ML) and reinforcement learning (adaptive ML). One classifies, the other learns and improves.
PART 1: LORENTZIAN TEMPORAL DYNAMICS
Markets don't experience time uniformly. During explosive volatility, price can compress weeks of movement into minutes. During consolidation, time dilates. Traditional indicators ignore this, using fixed periods regardless of market state.
The Lorentzian approach models market time using the Lorentz factor from special relativity:
γ = 1 / √(1 - v²/c²)
Where:
• v (velocity): Trend momentum normalized by ATR, calculated as (close - close ) / (N × ATR)
• c (speed limit): Realized volatility + volatility bursts, multiplied by c_multiplier parameter
• γ (gamma): Time dilation factor that compresses or expands effective lookback periods
When trend velocity approaches the volatility "speed limit," gamma spikes above 1.0, compressing time. Every calculation length becomes: base_period / γ. This creates shorter, more responsive periods during explosive moves and longer, more stable periods during quiet consolidation.
The system raises gamma to an optional power (gamma_power parameter) for fine control over compression strength, then applies this temporal scaling to every calculation in the indicator. This isn't metaphor—it's quantitative adaptation to the market's intrinsic clock.
PART 2: LORENTZIAN KERNEL SMOOTHING
Traditional moving averages use uniform weights (SMA) or exponential decay (EMA). The Lorentzian kernel uses heavy-tailed weighting:
K(distance, γ) = 1 / (1 + (distance/γ)²)
This Cauchy-like distribution gives more influence to recent extremes than Gaussian assumptions suggest, capturing the fat-tailed nature of financial returns. For any calculation requiring smoothing, the system loops through historical bars, computes Lorentzian kernel weights based on temporal distance and current gamma, then produces weighted averages.
This creates adaptive smoothing that responds to local volatility structure rather than imposing rigid assumptions about price distribution.
PART 3: HARMONIC FLOW (Multi-Timeframe Momentum)
The core directional signal comes from Harmonic Flow (HFL) , which blends three gamma-compressed Lorentzian smooths:
• Short Horizon: base_period × short_ratio / γ (default: 34 × 0.5 / γ ≈ 17 bars, faster with high γ)
• Mid Horizon: base_period × mid_ratio / γ (default: 34 × 1.0 / γ ≈ 34 bars, anchor timeframe)
• Long Horizon: base_period × long_ratio / γ (default: 34 × 2.5 / γ ≈ 85 bars, structural trend)
Each produces a Lorentzian-weighted smooth, converted to a z-score (distance from smooth normalized by ATR). These z-scores are then weighted-averaged:
HFL = (w_short × z_short + w_mid × z_mid + w_long × z_long) / (w_short + w_mid + w_long)
Default weights (0.45, 0.35, 0.20) favor recent momentum while respecting longer structure. Scalpers can increase short weight; swing traders can emphasize long weight. The result is a directional momentum indicator that captures multi-timeframe flow in compressed time.
From HFL, the system derives:
• Flow Velocity: HFL - HFL (momentum acceleration)
• Flow Acceleration: Second derivative (turning points)
• Temporal Compression Index (TCI): base_period / compressed_length (shows how much time is compressed)
PART 4: DUAL MEMORY ARCHITECTURE
Markets have memory—current conditions resonate with past regimes. But memory operates on two timescales, inspiring this indicator's dual-memory design:
SHORT-TERM MEMORY (STM):
• Capacity: 100 patterns (configurable 50-200)
• Decay Rate: 0.980 (50% weight after ~35 bars)
• Update Frequency: Every 10 bars
• Purpose: Capture current regime's tactical patterns
• Storage: Recent market states with 10-bar forward outcomes
• Analogy: Hippocampus (rapid encoding, fast fade)
LONG-TERM MEMORY (LTM):
• Capacity: 512 patterns (configurable 256-1024)
• Decay Rate: 0.997 (50% weight after ~230 bars)
• Quality Gate: Only high-quality patterns admitted (adaptive threshold per regime)
• Purpose: Strategic pattern library validated across regimes
• Storage: Validated patterns from weeks/months of history
• Analogy: Neocortex (slow consolidation, persistent storage)
Each memory stores 6-dimensional feature vectors:
1. HFL (harmonic flow strength)
2. Flow Velocity (momentum)
3. Flow Acceleration (turning points)
4. Volatility (realized vol EMA)
5. Entropy (market uncertainty)
6. Gamma (time compression state)
Plus the actual outcome (10-bar forward return).
K-NEAREST NEIGHBORS (KNN) PATTERN MATCHING:
When evaluating current market state, the system queries both memories using Lorentzian distance :
distance = Σ (1 - K(|feature_current - feature_memory|, γ))
This calculates similarity across all 6 dimensions using the same Lorentzian kernel, weighted by current gamma. The system finds K nearest neighbors (default: 8), weights each by:
• Similarity: Lorentzian kernel distance
• Age: Exponential decay based on bars since pattern
• Regime: Only patterns from similar regimes count
The weighted average of these neighbors' outcomes becomes the prediction. High-confidence predictions require both high similarity and agreement between multiple neighbors.
REGIME-AWARE BLENDING:
STM and LTM predictions are blended adaptively:
• High Vol Range regime: Trust STM 70% (recent matters in chaos)
• Trending regimes: Trust LTM 70% (structure matters in trends)
• Normal regimes: 50/50 blend
Agreement metric: When STM and LTM strongly disagree, the system flags low confidence—often indicating regime transition or novel market conditions requiring caution.
PART 5: FIVE-REGIME MARKET CLASSIFICATION
Traditional regime detection stops at "trending vs ranging." This system detects five distinct market states using linear regression slope and volatility analysis:
REGIME 0: TRENDING BULL ↗
• Detection: LR slope > trend_threshold (default: 0.3)
• Characteristics: Sustained positive HFL, elevated gamma, low entropy
• Best Strategy: B (Flow Momentum)
• Trading Behavior: Follow momentum, trail stops, pyramid winners
REGIME 1: TRENDING BEAR ↘
• Detection: LR slope < -trend_threshold
• Characteristics: Sustained negative HFL, elevated gamma, low entropy
• Best Strategy: B (Flow Momentum)
• Trading Behavior: Follow momentum short, aggressive exits on reversal
REGIME 2: HIGH VOL RANGE ↔
• Detection: |slope| < threshold AND vol_ratio > vol_expansion_threshold (default: 1.5)
• Characteristics: Oscillating HFL, high gamma spikes, high entropy
• Best Strategies: A (Squeeze Breakout) or C (Memory Pattern)
• Trading Behavior: Fade extremes, tight stops, quick profits
REGIME 3: LOW VOL RANGE —
• Detection: |slope| < threshold AND vol_ratio < vol_expansion_threshold
• Characteristics: Low HFL magnitude, gamma ≈ 1, squeeze conditions
• Best Strategy: A (Squeeze Breakout)
• Trading Behavior: Wait for breakout, wide stops on breakout entry
REGIME 4: TRANSITION ⚡
• Detection: Trend reversal OR volatility spike > 1.5× threshold
• Characteristics: Erratic gamma, high entropy, conflicting signals
• Best Strategy: None (often unfavorable)
• Trading Behavior: Stand aside, wait for clarity
Each regime gets a confidence score (0-1) measuring how clearly defined it is. Low confidence indicates messy, ambiguous conditions.
PART 6: THREE INDEPENDENT TRADING STRATEGIES
Rather than one signal logic, the system implements three distinct approaches:
STRATEGY A: SQUEEZE BREAKOUT
• Logic: Bollinger Bands squeeze release + HFL direction + flow velocity confirmation
• Calculation: Compares BB width to Keltner Channel width; fires when BB expands beyond KC
• Strength Score: 70 + compression_strength × 0.3 (tighter squeeze = higher score)
• Best Regimes: Low Vol Range (3), Transition exit (4→0 or 4→1)
• Pattern: Volatility contraction → directional expansion
• Philosophy: Calm before the storm; compression precedes explosion
STRATEGY B: LORENTZIAN FLOW MOMENTUM
• Logic: Strong HFL (×flow_mult) + positive velocity + gamma > 1.1 + NOT squeezing
• Calculation: |HFL × flow_mult| > 0.12, velocity confirms direction, gamma shows acceleration
• Strength Score: |HFL × flow_mult| × 80 + gamma × 10
• Best Regimes: Trending Bull (0), Trending Bear (1)
• Pattern: Established momentum → acceleration in compressed time
• Philosophy: Trend is friend when spacetime curves
STRATEGY C: MEMORY PATTERN MATCHING
• Logic: Dual KNN prediction > threshold + high confidence + agreement + HFL confirms
• Calculation: |memory_pred| > 0.005, memory_conf > 1.0, agreement > 0.5, HFL direction matches
• Strength Score: |prediction| × 800 × agreement
• Best Regimes: High Vol Range (2), sometimes others with sufficient pattern library
• Pattern: Historical similarity → outcome resonance
• Philosophy: Markets rhyme; learn from validated patterns
Each strategy generates independent strength scores. In multi-strategy mode (enabled by default), the system selects one strategy per regime based on risk-adjusted performance. In weighted mode (multi-strategy disabled), all three fire simultaneously with configurable weights.
PART 7: ADAPTIVE LEARNING & BAYESIAN SELECTION
This is where machine learning meets trading. The system maintains 15 independent performance matrices :
3 strategies × 5 regimes = 15 tracking systems
For each combination, it tracks:
• Trade Count: Number of completed trades
• Win Count: Profitable outcomes
• Total Return: Sum of percentage returns
• Squared Returns: For variance/Sharpe calculation
• Equity Curve: Virtual P&L assuming 10% risk per trade
• Peak Equity: All-time high for drawdown calculation
• Max Drawdown: Peak-to-trough decline
RISK-ADJUSTED SCORING:
For current regime, the system scores each strategy:
Sharpe Ratio: (mean_return / std_dev) × √252
Calmar Ratio: total_return / max_drawdown
Win Rate: wins / trades
Combined Score = 0.6 × Sharpe + 0.3 × Calmar + 0.1 × Win_Rate
The strategy with highest score is selected. This is similar to Thompson Sampling (multi-armed bandits) but uses deterministic selection rather than probabilistic sampling due to Pine Script limitations.
BOOTSTRAP MODE (Critical for Understanding):
For the first min_regime_samples trades (default: 10) in each regime:
• Status: "🔥 BOOTSTRAP (X/10)" displayed in dashboard
• Behavior: All signals allowed (gathering data)
• Regime Filter: Disabled (can't judge with insufficient data)
• Purpose: Avoid cold-start problem, build statistical foundation
After reaching threshold:
• Status: "✅ FAVORABLE" (score > 0.5) or "⚠️ UNFAVORABLE" (score ≤ 0.5)
• Behavior: Only trade favorable regimes (if enable_regime_filter = true)
• Learning: Parameters adapt based on outcomes
This solves a critical problem: you can't know which strategy works in a regime without data, but you can't get data without trading. Bootstrap mode gathers initial data safely, then switches to selective mode once statistical confidence emerges.
PARAMETER ADAPTATION (Per Regime):
Three parameters adapt independently for each regime based on outcomes:
1. SIGNAL QUALITY THRESHOLD (30-90):
• Starts: base_quality_threshold (default: 60)
• Adaptation:
Win Rate < 45% → RAISE threshold by learning_rate × 10 (be pickier)
Win Rate > 55% → LOWER threshold by learning_rate × 5 (take more)
• Effect: System becomes more selective in losing regimes, more aggressive in winning regimes
2. LTM QUALITY GATE (0.2-0.8):
• Starts: 0.4 (if adaptive gate enabled)
• Adaptation:
Sharpe < 0.5 → RAISE gate by learning_rate (demand better patterns)
Sharpe > 1.5 → LOWER gate by learning_rate × 0.5 (accept more patterns)
• Effect: LTM fills with high-quality patterns from winning regimes
3. FLOW MULTIPLIER (0.5-2.0):
• Starts: 1.0
• Adaptation:
Strong win (+2%+) → MULTIPLY by (1 + learning_rate × 0.1)
Strong loss (-2%+) → MULTIPLY by (1 - learning_rate × 0.1)
• Effect: Amplifies signal strength in profitable regimes, dampens in unprofitable
Each regime evolves independently. Trending Bull might develop threshold=55, gate=0.35, mult=1.3 while High Vol Range develops threshold=70, gate=0.50, mult=0.9.
PART 8: SHADOW PORTFOLIO VALIDATION
To validate learning objectively, the system runs three virtual portfolios :
Shadow Portfolio A: Trades only Strategy A signals
Shadow Portfolio B: Trades only Strategy B signals
Shadow Portfolio C: Trades only Strategy C signals
When any signal fires:
1. Open virtual position for corresponding strategy
2. On exit, calculate P&L (10% risk per trade)
3. Update equity, win count, profit factor
Dashboard displays:
• Equity: Current virtual balance (starts $10,000)
• Win%: Overall win rate across all regimes
• PF: Profit Factor (gross_profit / gross_loss)
This transparency shows which strategies actually perform, validates the selection logic, and prevents overfitting. If Shadow C shows $12,500 equity while A and B show $9,800, it confirms Strategy C's edge.
PART 9: HISTORICAL PRE-TRAINING
The system includes historical pre-training to avoid cold-start:
On Chart Load (if enabled):
1. Scan past pretrain_bars (default: 200)
2. Calculate historical HFL, gamma, velocity, acceleration, volatility, entropy
3. Compute 10-bar forward returns as outcomes
4. Populate STM with recent patterns
5. Populate LTM with high-quality patterns (quality > 0.4)
Effect:
• Without pre-training: Memories empty, no predictions for weeks, pure bootstrap
• With pre-training: System starts with pattern library, predictions from day one
Pre-training uses only past data (no future peeking) and fills memories with validated outcomes. This dramatically accelerates learning without compromising integrity.
PART 10: COMPREHENSIVE INPUT SYSTEM
The indicator provides 50+ inputs organized into logical groups. Here are the key parameters and their market-specific guidance:
🧠 ADAPTIVE LEARNING SYSTEM:
Enable Adaptive Learning (true/false):
• Function: Master switch for regime-specific strategy selection and parameter adaptation
• Enabled: System learns which strategies work in which regimes (recommended)
• Disabled: All strategies fire simultaneously with fixed weights (simpler, less adaptive)
• Recommendation: Keep enabled for all markets; system needs 2-3 months to mature
Learning Rate (0.01-0.20):
• Function: Speed of parameter adaptation based on outcomes
• Stocks/ETFs: 0.03-0.05 (slower, more stable)
• Crypto: 0.05-0.08 (faster, adapts to volatility)
• Forex: 0.04-0.06 (moderate)
• Timeframes:
1-5min scalping: 0.08-0.10 (rapid adaptation)
15min-1H day trading: 0.05-0.07 (balanced)
4H-Daily swing: 0.03-0.05 (conservative)
• Tradeoff: Higher = responsive but may overfit; Lower = stable but slower to adapt
Min Samples Per Regime (5-30):
• Function: Trades required before exiting bootstrap mode
• Active trading (>5 signals/day): 8-10 trades
• Moderate (1-5 signals/day): 10-15 trades
• Swing (few signals/week): 5-8 trades
• Logic: Bootstrap mode until this threshold; then uses Sharpe/Calmar for regime filtering
• Tradeoff: Lower = faster exit (risky, less data); Higher = more validation (safer, slower)
🌍 REGIME DETECTION:
Regime Lookback Period (20-200):
• Function: Bars used for linear regression to classify regime
• By Timeframe:
1-5min: 30-50 bars (~2-4 hour context)
15min: 40-60 bars (daily context)
1H: 50-100 bars (weekly context)
4H: 100-150 bars (monthly context)
Daily: 50-75 bars (quarterly context)
• By Market:
Crypto: 40-60 (faster regime changes)
Forex: 50-75 (moderate stability)
Stocks: 60-100 (slower structural trends)
• Tradeoff: Shorter = more regime switches (reactive); Longer = fewer switches (stable)
Trend Strength Threshold (0.1-0.8):
• Function: Minimum normalized LR slope to classify as trending vs ranging
• Lower (0.1-0.2): More markets classified as trending
• Higher (0.4-0.6): Only strong trends qualify
• Recommendations:
Choppy markets (BTC, small caps): 0.25-0.35
Smooth trends (major FX pairs): 0.30-0.40
Strong trends (indices during bull): 0.20-0.30
• Effect: Controls sensitivity of trending vs ranging classification
Vol Expansion Factor (1.2-3.0):
• Function: Volatility ratio to classify high-vol regimes (current_vol / avg_vol)
• By Asset:
Bitcoin: 1.4-1.6 (frequent vol spikes)
Altcoins: 1.3-1.5 (very volatile)
Major FX (EUR/USD): 1.6-2.0 (stable baseline)
Stocks (SPY): 1.5-1.8 (moderate)
Penny stocks: 1.3-1.4 (always volatile)
• Impact: Higher = fewer "High Vol Range" classifications; Lower = more sensitive to volatility spikes
🎯 SIGNAL GENERATION:
Base Quality Threshold (30-90):
• Function: Starting signal strength requirement (adapts per regime)
• THIS IS YOUR MAIN SIGNAL FREQUENCY CONTROL
• Conservative (70-80): Fewer, higher-quality signals
• Balanced (55-65): Moderate signal flow
• Aggressive (40-50): More signals, more noise
• By Trading Style:
Scalping (1-5min): 50-60
Day trading (15min-1H): 60-70
Swing (4H-Daily): 65-75
• Adaptive Behavior: System raises this in losing regimes (pickier), lowers in winning regimes (take more)
Min Confidence (0.1-0.9):
• Function: Minimum confidence score to fire signal
• Calculation: (Signal_Strength / 100) × Regime_Confidence
• Recommendations:
High-frequency (scalping): 0.2-0.3 (permissive)
Day trading: 0.3-0.4 (balanced)
Swing/position: 0.4-0.6 (selective)
• Interaction: During Transition regime (low regime confidence), even strong signals may fail confidence check; creates natural regime filtering
Only Trade Favorable Regimes (true/false):
• Function: Block signals in unfavorable regimes (where all strategies have negative risk-adjusted scores)
• Enabled (Recommended): Only trades when best strategy has positive Sharpe in current regime; auto-disables during bootstrap; protects capital
• Disabled: Always allows signals regardless of historical performance; use for manual regime assessment
• Bootstrap: Auto-allows trading until min_regime_samples reached, then switches to performance-based filtering
Min Bars Between Signals (1-20):
• Function: Prevents signal spam by enforcing minimum spacing
• By Timeframe:
1min: 3-5 bars (3-5 minutes)
5min: 3-6 bars (15-30 minutes)
15min: 4-8 bars (1-2 hours)
1H: 5-10 bars (5-10 hours)
4H: 3-6 bars (12-24 hours)
Daily: 2-5 bars (2-5 days)
• Logic: After signal fires, no new signals for X bars
• Tradeoff: Lower = more reactive (may overtrade); Higher = more patient (may miss reversals)
🌀 LORENTZIAN CORE:
Base Period (10-100):
• Function: Core time period for flow calculation (gets compressed by gamma)
• THIS IS YOUR PRIMARY TIMEFRAME KNOB
• By Timeframe:
1-5min scalping: 20-30 (fast response)
15min-1H day: 30-40 (balanced)
4H swing: 40-55 (smooth)
Daily position: 50-75 (very smooth)
• By Market Character:
Choppy (crypto, small caps): 25-35 (faster)
Smooth (major FX, indices): 35-50 (moderate)
Slow (bonds, utilities): 45-65 (slower)
• Gamma Effect: Actual length = base_period / gamma; High gamma compresses to ~20 bars, low gamma expands to ~50 bars
• Default 34 (Fibonacci) works well across most assets
Velocity Period (5-50):
• Function: Window for trend velocity calculation: (price_now - price ) / (N × ATR)
• By Timeframe:
1-5min scalping: 8-12 (fast momentum)
15min-1H day: 12-18 (balanced)
4H swing: 14-21 (smooth trend)
Daily: 18-30 (structural trend)
• By Market:
Crypto (fast moves): 10-14
Stocks (moderate): 14-20
Forex (smooth): 18-25
• Impact: Feeds into gamma calculation (v/c ratio); shorter = more sensitive to velocity spikes → higher gamma
• Relationship: Typically vel_period ≈ base_period / 2 to 2/3
Speed-of-Market (c) (0.5-3.0):
• Function: "Speed limit" for gamma calculation: c = realized_vol + vol_burst × c_multiplier
• By Asset Volatility:
High vol (BTC, TSLA): 1.0-1.3 (lower c = more compression)
Medium vol (SPY, EUR/USD): 1.3-1.6 (balanced)
Low vol (bonds, utilities): 1.6-2.5 (higher c = less compression)
• What It Does:
Lower c → velocity hits "speed limit" sooner → higher gamma → more compression
Higher c → velocity rarely hits limit → gamma stays near 1 → less adaptation
• Effect on Signals: More compression (low c) = faster regime detection, more responsive; Less compression (high c) = smoother, less adaptive
• Tuning: Start at 1.4; if gamma always ~1.0, lower to 1.0-1.2; if gamma spikes >5 often, raise to 1.6-2.0
Gamma Power (0.5-2.0):
• Function: Exponent applied to gamma: final_gamma = gamma^power
• Compression Strength:
0.5-0.8: Softens compression (gamma 4 → 2)
1.0: Linear (gamma 4 → 4)
1.2-2.0: Amplifies compression (gamma 4 → 16)
• Use Cases:
Reduce power (<1.0) if adaptive lengths swing too wildly or getting whipsawed
Increase power (>1.0) for more aggressive regime adaptation in fast markets
• Most users should leave at 1.0; only adjust if gamma behavior needs tuning
Max Kernel Lookback (20-200):
• Function: Computational limit for Lorentzian smoothing (performance control)
• Recommendations:
Fast PC / simple chart: 80-100
Slow PC / complex chart: 40-60
Mobile / lots of indicators: 30-50
• Impact: Each kernel smoothing loops through this many bars; higher = more accurate but slower
• Default 60 balances accuracy and speed; lower to 40-50 if indicator is slow
🎼 HARMONIC FLOW:
Short Horizon (0.2-1.0):
• Function: Fast timeframe multiplier: short_length = base_period × short_ratio / gamma
• Default: 0.5 (captures 2× faster flow than base)
• By Style:
Scalping: 0.3-0.4 (very fast)
Day trading: 0.4-0.6 (moderate)
Swing: 0.5-0.7 (balanced)
• Effect: Lower = more weight on micro-moves; Higher = smooths out fast fluctuations
Mid Horizon (0.5-2.0):
• Function: Medium timeframe multiplier: mid_length = base_period × mid_ratio / gamma
• Default: 1.0 (equals base_period, anchor timeframe)
• Usually keep at 1.0 unless specific strategy needs fine-tuning
Long Horizon (1.0-5.0):
• Function: Slow timeframe multiplier: long_length = base_period × long_ratio / gamma
• Default: 2.5 (captures trend/structure)
• By Style:
Scalping: 1.5-2.0 (less long-term influence)
Day trading: 2.0-3.0 (balanced)
Swing: 2.5-4.0 (strong trend component)
• Effect: Higher = more emphasis on larger structure; Lower = more reactive to recent price action
Short Weight (0-1):
Mid Weight (0-1):
Long Weight (0-1):
• Function: Relative importance in HFL calculation (should sum to 1.0)
• Defaults: Short: 0.45, Mid: 0.35, Long: 0.20 (day trading balanced)
• Preset Configurations:
SCALPING (fast response):
Short: 0.60, Mid: 0.30, Long: 0.10
DAY TRADING (balanced):
Short: 0.45, Mid: 0.35, Long: 0.20
SWING (trend-following):
Short: 0.25, Mid: 0.35, Long: 0.40
• Effect: More short weight = responsive but noisier; More long weight = smoother but laggier
🧠 DUAL MEMORY SYSTEM:
Enable Pattern Memory (true/false):
• Function: Master switch for KNN pattern matching via dual memory
• Enabled (Recommended): Strategy C (Memory Pattern) can fire; memory predictions influence all strategies; prediction arcs shown; heatmaps available
• Disabled: Only Strategy A and B available; faster performance (less computation); pure technical analysis (no pattern matching)
• Keep enabled for full system capabilities; disable only if CPU-constrained or testing pure flow signals
STM Size (50-200):
• Function: Short-Term Memory capacity (recent pattern storage)
• Characteristics: Fast decay (0.980), captures current regime, updates every 10 bars, tactical pattern matching
• Sizing:
Active markets (crypto): 80-120
Moderate (stocks): 100-150
Slow (bonds): 50-100
• By Timeframe:
1-15min: 60-100 (captures few hours of patterns)
1H: 80-120 (captures days)
4H-Daily: 100-150 (captures weeks/months)
• Tradeoff: More = better recent pattern coverage; Less = faster computation
• Default 100 is solid for most use cases
LTM Size (256-1024):
• Function: Long-Term Memory capacity (validated pattern storage)
• Characteristics: Slow decay (0.997), only high-quality patterns (gated), regime-specific recall, strategic pattern library
• Sizing:
Fast PC: 512-768
Medium PC: 384-512
Slow PC/Mobile: 256-384
• By Data Needs:
High-frequency (lots of patterns): 512-1024
Moderate activity: 384-512
Low-frequency (swing): 256-384
• Performance Impact: Each KNN search loops through entire LTM; 512 = good balance of coverage and speed; if slow, drop to 256-384
• Fills over weeks/months with validated patterns
STM Decay (0.95-0.995):
• Function: Short-Term Memory age decay rate: age_weight = decay^bars_since_pattern
• Decay Rates:
0.950: Aggressive fade (50% weight after 14 bars)
0.970: Moderate fade (50% after 23 bars)
0.980: Balanced (50% after 35 bars)
0.990: Slow fade (50% after 69 bars)
• By Timeframe:
1-5min: 0.95-0.97 (fast markets, old patterns irrelevant)
15min-1H: 0.97-0.98 (balanced)
4H-Daily: 0.98-0.99 (slower decay)
• Philosophy: STM should emphasize RECENT patterns; lower decay = only very recent matters; 0.980 works well for most cases
LTM Decay (0.99-0.999):
• Function: Long-Term Memory age decay rate
• Decay Rates:
0.990: 50% weight after 69 bars
0.995: 50% weight after 138 bars
0.997: 50% weight after 231 bars
0.999: 50% weight after 693 bars
• Philosophy: LTM should retain value for LONG periods; pattern from 6 months ago might still matter
• Usage:
Fast-changing markets: 0.990-0.995
Stable markets: 0.995-0.998
Structural patterns: 0.998-0.999
• Warning: Be careful with very high decay (>0.998); market structure changes, old patterns may mislead
• 0.997 balances long-term memory with regime evolution
K Neighbors (3-21):
• Function: Number of similar patterns to query in KNN search
• By Sample Size:
Small dataset (<100 patterns): 3-5
Medium dataset (100-300): 5-8
Large dataset (300-1000): 8-13
Very large (>1000): 13-21
• Tradeoff:
Fewer K (3-5): More reactive to closest matches; noisier; outlier-sensitive; better when patterns very distinct
More K (13-21): Smoother, more stable predictions; may dilute strong signals; better when patterns overlap
• Rule of Thumb: K ≈ √(memory_size) / 3; For STM=100, LTM=512: K ≈ 8-10 ideal
Adaptive Quality Gate (true/false):
• Function: Adapts LTM entry threshold per regime based on Sharpe ratio
• Enabled: Quality gate adapts: Low Sharpe → RAISE gate (demand better patterns); High Sharpe → LOWER gate (accept more patterns); each regime has independent gate
• Disabled: Fixed quality gate (0.4 default) for all regimes
• Recommended: Keep ENABLED; helps LTM focus on proven pattern types per regime; prevents weak patterns from polluting memory
🎯 MULTI-STRATEGY SYSTEM:
Enable Strategy Learning (true/false):
• Function: Core learning feature for regime-specific strategy selection
• Enabled: Tracks 3 strategies × 5 regimes = 15 performance matrices; selects best strategy per regime via Sharpe/Calmar/WinRate; adaptive strategy switching
• Disabled: All strategies fire simultaneously (weighted combination); no regime-specific selection; simpler but less adaptive
• Recommended: ENABLED (this is the core of the adaptive system); disable only for testing or simplification
Strategy A Weight (0-1):
• Function: Weight for Strategy A (Squeeze Breakout) when multi-strategy disabled
• Characteristics: Fires on Bollinger squeeze release; best in Low Vol Range, Transition; compression → expansion pattern
• When Multi-Strategy OFF: Default 0.33 (equal weight); increase to 0.4-0.5 for choppy ranges with breakouts; decrease to 0.2-0.3 for trending markets
• When Multi-Strategy ON: This is ignored (system auto-selects based on performance)
Strategy B Weight (0-1):
• Function: Weight for Strategy B (Lorentzian Flow) when multi-strategy disabled
• Characteristics: Fires on strong HFL + velocity + gamma; best in Trending Bull/Bear; momentum → acceleration pattern
• When Multi-Strategy OFF: Default 0.33; increase to 0.4-0.5 for trending markets; decrease to 0.2-0.3 for choppy/ranging markets
• When Multi-Strategy ON: Ignored (auto-selected)
Strategy C Weight (0-1):
• Function: Weight for Strategy C (Memory Pattern) when multi-strategy disabled
• Characteristics: Fires when dual KNN predicts strong move; best in High Vol Range; requires memory system enabled + sufficient data
• When Multi-Strategy OFF: Default 0.34; increase to 0.4-0.6 if strong pattern repetition and LTM has >200 patterns; decrease to 0.2-0.3 if new to system; set to 0.0 if memory disabled
• When Multi-Strategy ON: Ignored (auto-selected)
📚 PRE-TRAINING:
Historical Pre-Training (true/false):
• Function: Bootstrap feature that fills memory on chart load
• Enabled: Scans past bars to populate STM/LTM before live trading; calculates historical outcomes (10-bar forward returns); builds initial pattern library; system starts with context, not blank slate
• Disabled: Memories only populate in real-time; takes weeks to build pattern library
• Recommended: ENABLED (critical for avoiding "cold start" problem); disable only for testing clean learning
Training Bars (50-500):
• Function: How many historical bars to scan on load (limited by available history)
• Recommendations:
1-5min charts: 200-300 (few hours of history)
15min-1H: 200-400 (days/weeks)
4H: 300-500 (months)
Daily: 200-400 (years)
• Performance:
100 bars: ~1 second
300 bars: ~2-3 seconds
500 bars: ~4-5 seconds
• Sweet Spot: 200-300 (enough patterns without slow load)
• If chart loads slowly: Reduce to 100-150
🎨 VISUALIZATION:
Show Regime Background (true/false):
• Function: Color-code background by current regime
• Colors: Trending Bull (green tint), Trending Bear (red tint), High Vol Range (orange tint), Low Vol Range (blue tint), Transition (purple tint)
• Helps visually track regime changes
Show Flow Bands (true/false):
• Function: Plot upper/lower bands based on HFL strength
• Shows dynamic support/resistance zones; green fill = bullish flow; red fill = bearish flow
• Useful for visual trend confirmation
Show Confidence Meter (true/false):
• Function: Plot signal confidence (0-100) in separate pane
• Calculation: (Signal_Strength / 100) × Regime_Confidence
• Gold line = current confidence; dashed line = minimum threshold
• Signals fire when confidence exceeds threshold
Show Prediction Arc (true/false):
• Function: Dashed line projecting expected price move based on memory prediction
• NOT a price target - a probability vector; steep arc = strong expected move; flat arc = weak/uncertain prediction
• Green = bullish prediction; red = bearish prediction
Show Signals (true/false):
• Function: Triangle markers at entry points
• ▲ Green = Long signal; ▼ Red = Short signal
• Markers show on bar close (non-repainting)
🏆 DASHBOARD:
Show Dashboard (true/false):
• Function: Main info panel showing all system metrics
• Sections: Lorentzian Core, Regime, Dual Memory, Adaptive Parameters, Regime Performance, Shadow Portfolios, Current Signal Status
• Essential for understanding system state
Dashboard Position: Top Left, Top Right, Bottom Left, Bottom Right
Individual Section Toggles:
• System Stats: Lorentzian Core section (Gamma, v/c, HFL, TCI)
• Memory Stats: Dual Memory section (STM/LTM predictions, agreement)
• Shadow Portfolios: Shadow Portfolio table (equity, win%, PF)
• Adaptive Params: Adaptive Parameters section (threshold, quality gate, flow mult)
🔥 HEATMAPS:
Show Dual Heatmaps (true/false):
• Function: Visual pattern density maps for STM and LTM
• Layout: X-axis = pattern age (left=recent, right=old); Y-axis = outcome direction (top=bearish, bottom=bullish); Color intensity = pattern count; Color hue = bullish (green) vs bearish (red)
• Warning: Can clutter chart; disable if not using
Heatmap Position: Screen position for heatmaps (STM at selected position, LTM offset)
Resolution (5-15):
• Function: Grid resolution (bins)
• Higher = more detailed but smaller cells; Lower = clearer but less granular
• 10 is good balance; reduce to 6-8 if hard to read
PART 11: DASHBOARD METRICS EXPLAINED
The comprehensive dashboard provides real-time transparency into every aspect of the adaptive system:
⚡ LORENTZIAN CORE SECTION:
Gamma (γ):
• Range: 1.0 to ~10.0 (capped)
• Interpretation:
γ ≈ 1.0-1.2: Normal market time, low velocity
γ = 1.5-2.5: Moderate compression, trending
γ = 3.0-5.0: High compression, explosive moves
γ > 5.0: Extreme compression, parabolic volatility
• Usage: High gamma = system operating in compressed time; expect shorter effective periods and faster adaptation
v/c (Velocity / Speed Limit):
• Range: 0.0 to 0.999 (approaches but never reaches 1.0)
• Interpretation:
v/c < 0.3: Slow market, low momentum
v/c = 0.4-0.7: Moderate trending
v/c > 0.7: Approaching "speed limit," high velocity
v/c > 0.9: Parabolic move, system at limit
• Color Coding: Red (>0.7), Gold (0.4-0.7), Green (<0.4)
• Usage: High v/c warns of extreme conditions where trend may exhaust
HFL (Harmonic Flow):
• Range: Typically -3.0 to +3.0 (can exceed in extremes)
• Interpretation:
HFL > 0: Bullish flow
HFL < 0: Bearish flow
|HFL| > 0.5: Strong directional bias
|HFL| < 0.2: Weak, indecisive
• Color: Green (positive), Red (negative)
• Usage: Primary directional indicator; strategies often require HFL confirmation
TCI (Temporal Compression Index):
• Calculation: base_period / compressed_length
• Interpretation:
TCI ≈ 1.0: No compression, normal time
TCI = 1.5-2.5: Moderate compression
TCI > 3.0: Significant compression
• Usage: Shows how much time is being compressed; mirrors gamma but more intuitive
╔═══ REGIME SECTION ═══╗
Current:
• Display: Regime name with icon (Trending Bull ↗, Trending Bear ↘, High Vol Range ↔, Low Vol Range —, Transition ⚡)
• Color: Gold for visibility
• Usage: Know which regime you're in; check regime performance to see expected strategy behavior
Confidence:
• Range: 0-100%
• Interpretation:
>70%: Very clear regime definition
40-70%: Moderate clarity
<40%: Ambiguous, mixed conditions
• Color: Green (>70%), Gold (40-70%), Red (<40%)
• Usage: High confidence = trust regime classification; low confidence = regime may be transitioning
Mode:
• States:
🔥 BOOTSTRAP (X/10): Still gathering data for this regime
✅ FAVORABLE: Best strategy has positive risk-adjusted score (>0.5)
⚠️ UNFAVORABLE: All strategies have negative scores (≤0.5)
• Color: Orange (bootstrap), Green (favorable), Red (unfavorable)
• Critical Importance: This tells you whether the system will trade or stand aside (if regime filter enabled)
╔═══ DUAL MEMORY KNN SECTION ═══╗
STM (Size):
• Display: Number of patterns currently in STM (0 to stm_size)
• Interpretation: Should fill to capacity within hours/days; if not filling, check that memory is enabled
STM Pred:
• Range: Typically -0.05 to +0.05 (representing -5% to +5% expected 10-bar move)
• Color: Green (positive), Red (negative)
• Usage: STM's prediction based on recent patterns; emphasis on current regime
LTM (Size):
• Display: Number of patterns in LTM (0 to ltm_size)
• Interpretation: Fills slowly (weeks/months); only validated high-quality patterns; check quality gate if not filling
LTM Pred:
• Range: Similar to STM pred
• Color: Green (positive), Red (negative)
• Usage: LTM's prediction based on long-term validated patterns; more strategic than tactical
Agreement:
• Display:
✅ XX%: Strong agreement (>70%) - both memories aligned
⚠️ XX%: Moderate agreement (40-70%) - some disagreement
❌ XX%: Conflict (<40%) - memories strongly disagree
• Color: Green (>70%), Gold (40-70%), Red (<40%)
• Critical Usage: Low agreement often precedes regime change or signals novel conditions; Strategy C won't fire with low agreement
╔═══ ADAPTIVE PARAMS SECTION ═══╗
Threshold:
• Display: Current regime's signal quality threshold (30-90)
• Interpretation: Higher = pickier; lower = more permissive
• Watch For: If steadily rising in a regime, system is struggling (low win rate); if falling, system is confident
• Default: Starts at base_quality_threshold (usually 60)
Quality:
• Display: Current regime's LTM quality gate (0.2-0.8)
• Interpretation: Minimum quality score for pattern to enter LTM
• Watch For: If rising, system demanding higher-quality patterns; if falling, accepting more diverse patterns
• Default: Starts at 0.4
Flow Mult:
• Display: Current regime's flow multiplier (0.5-2.0)
• Interpretation: Amplifies or dampens HFL for Strategy B
• Watch For: If >1.2, system found strong edge in flow signals; if <0.8, flow signals underperforming
• Default: Starts at 1.0
Learning:
• Display: ✅ ON or ❌ OFF
• Shows whether adaptive learning is enabled
• Color: Green (on), Red (off)
╔═══ REGIME PERFORMANCE SECTION ═══╗
This table shows ONLY the current regime's statistics:
S (Strategy):
• Display: A, B, or C
• Color: Gold if selected strategy; gray if not
• Shows which strategies have data in this regime
Trades:
• Display: Number of completed trades for this pair
• Interpretation: Blank or low numbers mean bootstrap mode; >10 means statistical significance building
Win%:
• Display: Win rate percentage
• Color: Green (>55%), White (45-55%), Red (<45%)
• Interpretation: 52%+ is good; 58%+ is excellent; <45% means struggling
• Note: Short-term variance is normal; judge after 20+ trades
Sharpe:
• Display: Annualized Sharpe ratio
• Color: Green (>1.0), White (0-1.0), Red (<0)
• Interpretation:
>2.0: Exceptional (rare)
1.0-2.0: Good
0.5-1.0: Acceptable
0-0.5: Marginal
<0: Losing
• Usage: Primary metric for strategy selection (60% weight in score)
╔═══ SHADOW PORTFOLIOS SECTION ═══╗
Shows virtual equity tracking across ALL regimes (not just current):
S (Strategy):
• Display: A, B, or C
• Color: Gold if currently selected strategy; gray otherwise
Equity:
• Display: Current virtual balance (starts $10,000)
• Color: Green (>$10,000), White ($9,500-$10,000), Red (<$9,500)
• Interpretation: Which strategy is actually making virtual money across all conditions
• Note: 10% risk per trade assumed
Win%:
• Display: Overall win rate across all regimes
• Color: Green (>55%), White (45-55%), Red (<45%)
• Interpretation: Aggregate performance; strategy may do well in some regimes and poorly in others
PF (Profit Factor):
• Display: Gross profit / gross loss
• Color: Green (>1.5), White (1.0-1.5), Red (<1.0)
• Interpretation:
>2.0: Excellent
1.5-2.0: Good
1.2-1.5: Acceptable
1.0-1.2: Marginal
<1.0: Losing
• Usage: Confirms win rate; high PF with moderate win rate means winners >> losers
╔═══ STATUS BAR ═══╗
Display States:
• 🟢 LONG: Currently in long position (green background)
• 🔴 SHORT: Currently in short position (red background)
• ⬆️ LONG SIGNAL: Long signal present but not yet confirmed (waiting for bar close)
• ⬇️ SHORT SIGNAL: Short signal present but not yet confirmed
• ⚪ NEUTRAL: No position, no signal (white background)
Usage: Immediate visual confirmation of system state; check before manually entering/exiting
PART 12: VISUAL ELEMENT INTERPRETATION
REGIME BACKGROUND COLORS:
Green Tint: Trending Bull regime - expect Strategy B (Flow) to dominate; focus on long momentum
Red Tint: Trending Bear regime - expect Strategy B (Flow) shorts; focus on short momentum
Orange Tint: High Vol Range - expect Strategy A (Squeeze) or C (Memory); trade breakouts or patterns
Blue Tint: Low Vol Range - expect Strategy A (Squeeze); wait for compression release
Purple Tint: Transition regime - often unfavorable; system may stand aside; high uncertainty
Usage: Quick visual regime identification without reading dashboard
FLOW BANDS:
Upper Band: close + HFL × ATR × 1.5
Lower Band: close - HFL × ATR × 1.5
Green Fill: HFL positive (bullish flow); bands act as dynamic support/resistance in uptrend
Red Fill: HFL negative (bearish flow); bands act as dynamic resistance/support in downtrend
Usage:
• Bullish flow: Price bouncing off lower band = trend continuation; breaking below = possible reversal
• Bearish flow: Price rejecting upper band = trend continuation; breaking above = possible reversal
CONFIDENCE METER (Separate Pane):
Gold Line: Current signal confidence (0-100)
Dashed Line: Minimum confidence threshold
Interpretation:
• Line above threshold: Signal likely to fire if strength sufficient
• Line below threshold: Even if signal logic met, won't fire (insufficient confidence)
• Gradual rise: Signal building strength
• Sharp spike: Sudden conviction (check if sustainable)
Usage: Real-time signal probability; helps anticipate upcoming entries
PREDICTION ARC:
Dashed Line: Projects from current close to expected price 8 bars forward
Green Arc: Bullish memory prediction
Red Arc: Bearish memory prediction
Steep Arc: High conviction (strong expected move)
Flat Arc: Low conviction (weak/uncertain move)
Important: NOT a price target; this is a probability vector based on KNN outcomes; actual price may differ
Usage: Directional bias from pattern matching; confirms or contradicts flow signals
SIGNAL MARKERS:
▲ Green Triangle (below bar):
• Long signal confirmed on bar close
• Entry on next bar open
• Non-repainting (appears after bar closes)
▼ Red Triangle (above bar):
• Short signal confirmed on bar close
• Entry on next bar open
• Non-repainting
Size: Tiny (unobtrusive)
Text: "L" or "S" in marker
Usage: Historical signal record; alerts should fire on these; verify against dashboard status
DUAL HEATMAPS (If Enabled):
STM HEATMAP:
• X-axis: Pattern age (left = recent, right = older, typically 0-50 bars)
• Y-axis: Outcome direction (top = bearish outcomes, bottom = bullish outcomes)
• Color Intensity: Brightness = pattern count in that cell
• Color Hue: Green tint (bullish), Red tint (bearish), Gray (neutral)
Interpretation:
• Dense bottom-left: Many recent bullish patterns (bullish regime)
• Dense top-left: Many recent bearish patterns (bearish regime)
• Scattered: Mixed outcomes, ranging regime
• Empty areas: Few patterns (low data)
LTM HEATMAP:
• Similar layout but X-axis spans wider age range (0-500+ bars)
• Shows long-term pattern distribution
• Denser = more validated patterns
Comparison Usage:
• If STM and LTM heatmaps look similar: Current regime matches historical patterns (high agreement)
• If STM bottom-heavy but LTM top-heavy: Recent bullish activity contradicts historical bearish patterns (low agreement, transition signal)
PART 13: DEVELOPMENT STORY
The creation of the Lorentzian Harmonic Flow Adaptive ML system represents over six months of intensive research, mathematical exploration, and iterative refinement. What began as a theoretical investigation into applying special relativity to market time evolved into a complete adaptive learning framework.
THE CHALLENGE:
The fundamental problem was this: markets don't experience time uniformly, yet every indicator treats a 50-period calculation the same whether markets are exploding or sleeping. Traditional adaptive indicators adjust parameters based on volatility, but this is reactive—by the time you measure high volatility, the explosive move is over. What was needed was a framework that measured the market's intrinsic velocity relative to its own structural limits, then compressed time itself proportionally.
THE LORENTZIAN INSIGHT:
Einstein's special relativity provides exactly this framework through the Lorentz factor. When an object approaches the speed of light, time dilates—but from the object's reference frame, it experiences time compression. By treating price velocity as analogous to relativistic velocity and volatility structure as the "speed limit," we could calculate a gamma factor that compressed lookback periods during explosive moves.
The mathematics were straightforward in theory but devilishly complex in implementation. Pine Script has no native support for dynamically-sized arrays or recursive functions, forcing creative workarounds. The Lorentzian kernel smoothing required nested loops through historical bars, calculating kernel weights on the fly—a computational nightmare. Early versions crashed or produced bizarre artifacts (negative gamma values, infinite loops during volatility spikes).
Optimization took weeks. Limiting kernel lookback to 60 bars while still maintaining smoothing quality. Pre-calculating gamma once per bar and reusing it across all calculations. Caching intermediate results. The final implementation balances mathematical purity with computational reality.
THE MEMORY ARCHITECTURE:
With temporal compression working, the next challenge was pattern memory. Simple moving average systems have no memory—they forget yesterday's patterns immediately. But markets are non-stationary; what worked last month may not work today. The solution: dual-memory architecture inspired by cognitive neuroscience.
Short-Term Memory (STM) would capture tactical patterns—the hippocampus of the system. Fast encoding, fast decay, always current. Long-Term Memory (LTM) would store validated strategic patterns—the neocortex. Slow consolidation, persistent storage, regime-spanning wisdom.
The KNN implementation nearly broke me. Calculating Lorentzian distance across 6 dimensions for 500+ patterns per query, applying age decay, filtering by regime, finding K nearest neighbors without native sorting functions—all while maintaining sub-second execution. The breakthrough came from realizing we could use destructive sorting (marking found neighbors as "infinite distance") rather than maintaining separate data structures.
Pre-training was another beast. To populate memory with historical patterns, the system needed to scan hundreds of past bars, calculate forward outcomes, and insert patterns—all on chart load without timing out. The solution: cap at 200 bars, optimize loops, pre-calculate features. Now it works seamlessly.
THE REGIME DETECTION:
Five-regime classification emerged from empirical observation. Traditional trending/ranging dichotomy missed too much nuance. Markets have at least four distinct states: trending up, trending down, volatile range, quiet range—plus a chaotic transition state. Linear regression slope quantifies trend; volatility ratio quantifies expansion; combining them creates five natural clusters.
But classification is useless without regime-specific learning. That meant tracking 15 separate performance matrices (3 strategies × 5 regimes), computing Sharpe ratios and Calmar ratios for sparse data, implementing Bayesian-like strategy selection. The bootstrap mode logic alone took dozens of iterations—too strict and you never get data, too permissive and you blow up accounts during learning.
THE ADAPTIVE LAYER:
Parameter adaptation was conceptually elegant but practically treacherous. Each regime needed independent thresholds, quality gates, and multipliers that adapted based on outcomes. But naive gradient descent caused oscillations—win a few trades, lower threshold, take worse signals, lose trades, raise threshold, miss good signals. The solution: exponential smoothing via learning rate (α) and separate scoring for selection vs adaptation.
Shadow portfolios provided objective validation. By running virtual accounts for all strategies simultaneously, we could see which would have won even when not selected. This caught numerous bugs where selection logic was sound but execution was flawed, or vice versa.
THE DASHBOARD & VISUALIZATION:
A learning system is useless if users can't understand what it's doing. The dashboard went through five complete redesigns. Early versions were information dumps—too much data, no hierarchy, impossible to scan. The final version uses visual hierarchy (section headers, color coding, strategic whitespace) and progressive disclosure (show current regime first, then performance, then parameters).
The dual heatmaps were a late addition but proved invaluable for pattern visualization. Seeing STM cluster in one corner while LTM distributed broadly immediately signals regime novelty. Traders grasp this visually faster than reading disagreement percentages.
THE TESTING GAUNTLET:
Testing adaptive systems is uniquely challenging. Static backtest results mean nothing—the system should improve over time. Early "tests" showed abysmal performance because bootstrap periods were included. The breakthrough: measure pre-learning baseline vs post-learning performance. A system going from 48% win rate (first 50 trades) to 56% win rate (trades 100-200) is succeeding even if absolute performance seems modest.
Edge cases broke everything repeatedly. What happens when a regime never appears in historical data? When all strategies fail simultaneously? When memory fills with only bearish patterns during a bull run? Each required careful handling—bootstrap modes, forced diversification, quality gates.
THE DOCUMENTATION:
This isn't an indicator you throw on a chart with default settings and trade immediately. It's a learning system that requires understanding. The input tooltips alone contain over 10,000 words of guidance—market-specific recommendations, timeframe-specific settings, tradeoff explanations. Every parameter needed not just a description but a philosophical justification and practical tuning guide.
The code comments span 500+ lines explaining theory, implementation decisions, edge cases. Future maintainers (including myself in six months) need to understand not just what the code does but why certain approaches were chosen over alternatives.
WHAT ALMOST DIDN'T WORK:
The entire project nearly collapsed twice. First, when initial Lorentzian smoothing produced complete noise—hours of debugging revealed a simple indexing error where I was accessing instead of in the kernel loop. One character, entire system broken.
Second, when memory predictions showed zero correlation with outcomes. Turned out the KNN distance metric was dominated by the gamma dimension (values 1-10) drowning out normalized features (values -1 to 1). Solution: apply kernel transformation to all dimensions, not just final distance. Obvious in retrospect, maddening at the time.
THE PHILOSOPHY:
This system embodies a specific philosophy: markets are learnable but non-stationary. No single strategy works forever, but regime-specific patterns persist. Time isn't uniform, memory isn't perfect, prediction isn't possible—but probabilistic edges exist for those willing to track them rigorously.
It rejects the premise that indicators should give universal advice. Instead, it says: "In this regime, based on similar past states, Strategy B has a 58% win rate and 1.4 Sharpe. Strategy A has 45% and 0.2 Sharpe. I recommend B. But we're still in bootstrap for Strategy C, so I'm gathering data. Check back in 5 trades."
That humility—knowing what it knows and what it doesn't—is what makes it robust.
PART 14: PROFESSIONAL USAGE PROTOCOL
PHASE 1: DEPLOYMENT (Week 1-4)
Initial Setup:
1. Load indicator on primary trading chart with default settings
2. Verify historical pre-training enabled (should see ~200 patterns in STM/LTM on first load)
3. Enable all dashboard sections for maximum transparency
4. Set alerts but DO NOT trade real money
Observation Checklist:
• Dashboard Validation:
✓ Lorentzian Core shows reasonable gamma (1-5 range, not stuck at 1.0 or spiking to 10)
✓ HFL oscillates with price action (not flat or random)
✓ Regime classifications make intuitive sense
✓ Confidence scores vary appropriately
• Memory System:
✓ STM fills within first few hours/days of real-time bars
✓ LTM grows gradually (few patterns per day, quality-gated)
✓ Predictions show directional bias (not always 0.0)
✓ Agreement metric fluctuates with regime changes
• Bootstrap Tracking:
✓ Dashboard shows "🔥 BOOTSTRAP (X/10)" for each regime
✓ Trade counts increment on regime-specific signals
✓ Different regimes reach threshold at different rates
Paper Trading:
• Take EVERY signal (ignore unfavorable warnings during bootstrap)
• Log each trade: entry price, regime, selected strategy, outcome
• Calculate your actual P&L assuming proper risk management (1-2% risk per trade)
• Do NOT judge system performance yet—focus on understanding behavior
Troubleshooting:
• No signals for days:
- Check base_quality_threshold (try lowering to 50-55)
- Verify enable_regime_filter not blocking all regimes
- Confirm signal confidence threshold not too high (try 0.25)
• Signals every bar:
- Raise base_quality_threshold to 65-70
- Increase min_bars_between to 8-10
- Check if gamma spiking excessively (raise c_multiplier)
• Memory not filling:
- Confirm enable_memory = true
- Verify historical pre-training completed (check STM size after load)
- May need to wait 10 bars for first real-time update
PHASE 2: VALIDATION (Week 5-12)
Statistical Emergence:
By week 5-8, most regimes should exit bootstrap. Look for:
✓ Regime Performance Clarity:
- At least 2-3 strategies showing positive Sharpe in their favored regimes
- Clear separation (Strategy B strong in Trending, Strategy A strong in Low Vol Range, etc.)
- Win rates stabilizing around 50-60% for winning strategies
✓ Shadow Portfolio Divergence:
- Virtual portfolios showing clear winners ($10K → $11K+) and losers ($10K → $9K-)
- Profit factors >1.3 for top strategy
- System selection aligning with best shadow portfolio
✓ Parameter Adaptation:
- Thresholds varying per regime (not stuck at initial values)
- Quality gates adapting (some regimes higher, some lower)
- Flow multipliers showing regime-specific optimization
Validation Questions:
1. Do patterns make intuitive sense?
- Strategy B (Flow) dominating Trending Bull/Bear? ✓ Expected
- Strategy A (Squeeze) succeeding in Low Vol Range? ✓ Expected
- Strategy C (Memory) working in High Vol Range? ✓ Expected
- Random strategy winning everywhere? ✗ Problem
2. Is unfavorable filtering working?
- Regimes with negative Sharpe showing "⚠️ UNFAVORABLE"? ✓ System protecting capital
- Transition regime often unfavorable? ✓ Expected
- All regimes perpetually unfavorable? ✗ Settings too strict or asset unsuitable
3. Are memories agreeing appropriately?
- High agreement during stable regimes? ✓ Expected
- Low agreement during transitions? ✓ Expected (novel conditions)
- Perpetual conflict? ✗ Check memory sizes or decay rates
Fine-Tuning (If Needed):
Too Many Signals in Losing Regimes:
→ Increase learning_rate to 0.07-0.08 (faster adaptation)
→ Raise base_quality_threshold by 5-10 points
→ Enable regime filter if disabled
Missing Profitable Setups:
→ Lower base_quality_threshold by 5-10 points
→ Reduce min_confidence to 0.25-0.30
→ Check if bootstrap mode blocking trades (let it complete)
Excessive Parameter Swings:
→ Reduce learning_rate to 0.03-0.04
→ Increase min_regime_samples to 15-20 (more data before adaptation)
Memory Disagreement Too Frequent:
→ Increase LTM size to 768-1024 (broader pattern library)
→ Lower adaptive_quality_gate requirement (allow more patterns)
→ Increase K neighbors to 10-12 (smoother predictions)
PHASE 3: LIVE TRADING (Month 4+)
Pre-Launch Checklist:
1. ✓ At least 3 regimes show positive Sharpe (>0.8)
2. ✓ Top shadow portfolio shows >53% win rate and >1.3 profit factor
3. ✓ Parameters have stabilized (not changing more than 10% per month)
4. ✓ You understand every dashboard metric and can explain regime/strategy behavior
5. ✓ You have proper risk management plan independent of this system
Position Sizing:
Conservative (Recommended for Month 4-6):
• Risk per trade: 0.5-1.0% of account
• Max concurrent positions: 1-2
• Total exposure: 10-25% of intended full size
Moderate (Month 7-12):
• Risk per trade: 1.0-1.5% of account
• Max concurrent positions: 2-3
• Total exposure: 25-50% of intended size
Full Scale (Year 2+):
• Risk per trade: 1.5-2.0% of account
• Max concurrent positions: 3-5
• Total exposure: 100% (still following risk limits)
Entry Execution:
On Signal Confirmation:
1. Verify dashboard shows signal type (▲ LONG or ▼ SHORT)
2. Check regime mode (avoid if "⚠️ UNFAVORABLE" unless testing)
3. Note selected strategy (A/B/C) and its regime Sharpe
4. Verify memory agreement if Strategy C selected (want >60%)
Entry Method:
• Market entry: Next bar open after signal (for exact backtest replication)
• Limit entry: Slight improvement (2-3 ticks) if confident in direction
Stop Loss Placement:
• Strategy A (Squeeze): Beyond opposite band or recent swing point
• Strategy B (Flow): 1.5-2.0 ATR from entry against direction
• Strategy C (Memory): Based on predicted move magnitude (tighter if pred > 2%)
Exit Management:
System Exit Signals:
• Opposite signal fires: Immediate exit, potential reversal entry
• 20 bars no exit signal: System implies position stale, consider exiting
• Regime changes to unfavorable: Tighten stop, consider partial exit
Manual Exit Conditions:
• Stop loss hit: Take loss, log for validation (system expects some losses)
• Profit target hit: If using fixed targets (2-3R typical)
• Major news event: Flatten during high-impact news (system can't predict these)
Warning Signs (Exit Criteria):
🚨 Stop Trading If:
1. All regimes show negative Sharpe for 4+ weeks (market structure changed)
2. Your results >20% worse than shadow portfolios (execution problem)
3. Parameters hitting extremes (thresholds >85 or <35 across all regimes)
4. Memory agreement <30% for extended periods (unprecedented conditions)
5. Account drawdown >20% (risk management failure, system or otherwise)
⚠️ Reduce Size If:
1. Win rate drops 10%+ from peak (temporary regime shift)
2. Selected strategy underperforming another by >30% (selection lag)
3. Consecutive losses >5 (variance or problem, reduce until clarity)
4. Major market regime change (Fed policy shift, war, etc. - let system re-adapt)
PART 15: THEORETICAL IMPLICATIONS & LIMITATIONS
WHAT THIS SYSTEM REPRESENTS:
Contextual Bandits:
The regime-specific strategy selection implements a contextual multi-armed bandit problem. Each strategy is an "arm," each regime is a "context," and we select arms to maximize expected reward given context. This is reinforcement learning applied to trading.
Experience Replay:
The dual-memory architecture mirrors DeepMind's DQN breakthrough. STM = recent experience buffer; LTM = validated experience replay. This prevents catastrophic forgetting while enabling rapid adaptation—a key challenge in neural network training.
Meta-Learning:
The system learns how to learn. Parameter adaptation adjusts the system's own sensitivity and selectivity based on outcomes. This is "learning to learn"—optimizing the optimization process itself.
Non-Stationary Optimization:
Traditional backtesting assumes stationarity (past patterns persist). This system assumes non-stationarity and continuously adapts. The goal isn't finding "the best parameters" but tracking the moving optimum.
Regime-Conditional Policies:
Rather than a single strategy for all conditions, this implements regime-specific policies. This is contextual decision-making—environment state determines action selection.
FINAL WISDOM:
"The market is a complex adaptive system. To trade it successfully, one must also adapt. This indicator provides the framework—memory, learning, regime awareness—but wisdom comes from understanding when to trade, when to stand aside, and when to defer to conditions the system hasn't yet learned. The edge isn't in the algorithm alone; it's in the partnership between mathematical rigor and human judgment."
— Inspired by the intersection of Einstein's relativity, Kahneman's behavioral economics, and decades of quantitative trading research
Taking you to school. — Dskyz, Trade with insight. Trade with anticipation.

Smart Money Concepts [Riz]Smart Money Concepts is a comprehensive technical analysis tool for identifying institutional trading patterns and market structure. This indicator combines Smart Money Concepts (SMC), ICT methodology, and Wyckoff principles into one professional tool.
✨ KEY FEATURES
📊 VOLUMETRIC ORDER BLOCKS
• Visual representation of supply/demand zones with volume distribution
• Horizontal volume bars showing buy/sell composition inside each Order Block
• Automatic mitigation tracking
• Breaker Block detection (invalidated OBs acting as reversal zones)
• Strength rating system: ★ Weak, ★★ Medium, ★★★ Strong
• ATR-based size filtering to show only significant zones
📈 MARKET STRUCTURE DETECTION
• Break of Structure (BOS) and Change of Character (CHoCH) identification
• Higher Highs (HH), Higher Lows (HL), Lower Highs (LH), Lower Lows (LL) labels
• Internal structure pivots (iH/iL) for intraday analysis
• Auto-adjusting swing length based on timeframe
• Configurable confirmation methods (Close vs Wick-based)
💎 FAIR VALUE GAPS (FVG)
• Automatic detection of bullish and bearish imbalances
• Configurable mitigation percentage (default 50%)
• Visual tracking until gaps are filled
• Separate color schemes for clarity
💧 LIQUIDITY ANALYSIS
• Buy Side Liquidity (BSL) identification at swing highs
• Sell Side Liquidity (SSL) identification at swing lows
• Automatic sweep detection with visual confirmation
• Real-time alerts when liquidity is taken
⚖️ PREMIUM & DISCOUNT ZONES
• Dynamic range calculation based on configurable lookback period
• Equilibrium (EQ) level identification
• Previous Day High (PDH) and Previous Day Low (PDL) levels
• Helps identify favorable entry zones
📊 REAL-TIME DASHBOARD
• Live statistics on all detected patterns
• Active Order Blocks and FVGs count
• BOS/CHoCH occurrence tracking
• Liquidity sweep counters
• Recent market activity indicators
• Current trend bias display
• Fully customizable position and size
⚙️ CUSTOMIZATION OPTIONS
All aspects are fully customizable:
• Swing Length (1-50 bars) with auto-adjust for timeframe
• Max Active Order Blocks (10-100)
• Volume bar position (Left/Right) with mirror option
• Volume bar width percentage (10-50%)
• ATR size filter for Order Blocks
• Strength rating method (Touches/Age/Distance/Volume/Combined)
• All colors and transparency levels
• Dashboard position (9 locations available)
• Comprehensive alert system for all events
🎓 HOW IT WORKS
ORDER BLOCKS: Identified at the last candle before a Break of Structure. These represent institutional supply and demand zones. Volume is estimated based on candle characteristics and displayed as horizontal bars.
MARKET STRUCTURE: Tracks pivot highs and lows to determine if price is making Higher Highs/Higher Lows (bullish structure) or Lower Highs/Lower Lows (bearish structure). BOS indicates trend continuation, while CHoCH signals potential trend reversal.
LIQUIDITY: Swing highs represent Buy Side Liquidity where short positions have their stop losses. Swing lows represent Sell Side Liquidity where long positions have stop losses. The indicator tracks when these levels are "swept" by price.
FAIR VALUE GAPS: Three-candle patterns where the current candle's range doesn't overlap with the candle two bars ago, creating price imbalances that often get filled later.
📚 BEST PRACTICES
• Use on all timeframes - Auto-adjust feature optimizes settings automatically
• Look for confluence - Best setups occur when multiple concepts align (e.g., Order Block + liquidity sweep + discount zone)
• Consider risk/reward - Use Premium/Discount zones to identify favorable entry areas
• Respect market context - Order Blocks in the direction of overall trend tend to be more reliable
• Volume matters - Higher volume percentages in the expected direction may indicate stronger zones
⚠️ IMPORTANT NOTES
EDUCATIONAL TOOL: This indicator is designed for analysis and education, not as trading signals or investment advice.
VOLUME ESTIMATION: Buy/sell volume distribution is estimated based on candle characteristics since true buy/sell volume data is not available in Pine Script.
NO GUARANTEES: Past performance is not indicative of future results. All trading involves substantial risk.
RISK MANAGEMENT: Always use proper risk management and seek additional confirmation before making trading decisions.
OBJECT LIMITS: On very fast timeframes (1m, 5m) in highly volatile markets, the indicator may approach Pine Script's 500-object limit. Reduce max OBs/FVGs in settings if needed.
🔧 TECHNICAL SPECIFICATIONS
• Pine Script Version: v6
• Indicator Type: Overlay (displays on price chart)
• Maximum Objects: Optimized to stay within Pine Script limits
• Performance: Efficient rendering with configurable history management
• Updates: Real-time on every bar close
📖 METHODOLOGY
This indicator combines concepts from:
• Inner Circle Trader (ICT) methodology
• Smart Money Concepts (SMC) framework
• Wyckoff market analysis principles
• Order flow and volume spread analysis
⚖️ DISCLAIMER
This indicator is for educational and informational purposes only. It is not financial advice. Trading financial instruments carries substantial risk and may not be suitable for all investors. Past performance is not indicative of future results. Always conduct your own research and consult with a licensed financial advisor before making any investment decisions. The author assumes no responsibility for any losses incurred from using this indicator.

GOLD PRICES1. Introduction – The Indicator's Purpose
"This indicator is designed to help traders accurately identify entry and exit points, avoiding random trading decisions. It also aims to reduce uncalculated risk and improve trade quality by providing a clear reading of trends and potential reversal points."
2. Simplified Explanation of the Indicator's Operation
-"The indicator's operation relies on a set of technical elements that contribute to providing an accurate reading of market movement. First, it displays strong areas such as support and resistance levels, as these are points where the price frequently reacts and often experiences clear reversals.
-The indicator also works to determine the overall market trend, whether upward or downward, to help the trader enter with the correct trend and avoid counter-trading.
-In addition, the indicator calculates trading volumes and measures momentum to determine the strength of the current movement and its potential for continuation or weakening. When a set of technical conditions are met, the indicator provides precise entry alerts that help the trader seize suitable opportunities at the right time with the highest possible success rate."
3. Indicator Features
For example:
-Lightweight and fast on the chart.
-Identifies optimal buy/sell zones.
-Supports all timeframes.
-Provides reliable signals without noise.
-Includes clear visual tools for both beginners and professionals.
--------------------------------------------------------------------------
--------------------------------------------------------------------------
--------------------------------------------------------------------------
--------------------------------------------------------------------------
00 - Core (Primary choice: timeframe & implied mode
⭐ A Simple and Clear Explanation of the (D-W-M) Timeframe System
This option allows you to specify the type of drawing levels the indicator uses.
The indicator itself is the same… the same conditions… the same method… but only the range of movement changes according to the timeframe.
⭐ What are timeframes?
Timeframes = the candlestick timeframe.
Daily candle = D
Weekly candle = W
Monthly candle = M
The larger the timeframe, the greater the distance between the levels.
⭐ Explanation of D-W-M
🔹 1. D = Daily
Plots levels based on daily price movement.
The levels are close and small.
Suitable for scalping and short-term trading.
Gives more signals and faster price movement.
🔹 2. W = Weekly
Plots levels derived from a full week's price movement.
The levels are farther away and stronger than the daily level.
Suitable for medium-term trading (3–7 days). Fewer signals but higher accuracy.
🔹 3. M = Monthly
Based on a full month's movement.
Depicts significant and distant levels.
Suitable for long-term swing trading and in-depth analysis.
Signs are few but very strong.
⭐ Main Idea (Summary)
-The indicator is the same, -The rules are the same, -The calculation mechanism is the same…
But the difference between D/W/M is:
✔ Movement range
✔ Level strength
✔ Distance between entry points
✔ Signal duration
01 - Localization
⭐ What is this system?
This system completely changes the indicator's language.
It means that the words displayed on the chart are translated into the language you choose in the settings.
It's not just translation… It's a multilingual interface within the indicator.
⭐ What are its benefits?
Its benefits include:
✔ Making the indicator suitable for people from all over the world
✔ Displaying your chart in your preferred language
✔ Making the indicator more professional
✔ Making the indicator's wires and alerts speak your language
For example, if you have an Arabic-speaking user, they will see "Buy."
And if you have a foreign-speaking user, they will see "Buy."
Everyone can see it in their own language without you changing anything within the indicator.
⭐ What exactly does it do?
This system controls three main points:
1️⃣ Chart text interface
Types such as:
Buy / Sell
Target
Stop
Information
Translate to your chosen language.
2️⃣ Supports multiple languages
The system allows you to choose from:
Arabic
English
Turkish
Russian
Chinese
Japanese
Korean
Or Auto (automatically detects TradingView's language)
02 - Display & Colors
⭐ What is the function of this section?
This section is responsible for the Price Levels System using the indicator:
It determines whether to display historical levels or only the current ones.
It gives you complete control over the colors of the zones for each type (A, B, C, D).
In short, this entire section deals with the appearance of the levels on the chart.
⭐ Explanation of each line in a simple and understandable way:
🔵 1. group_levels
This is simply the name of the settings group.
All the settings appear within a section called:
"03 ▸ Price Levels" Organized and grouped in one place.
🔵 2. show_prev_levels
This is the most important option.
Function:
✔ Do you want to show levels for previous periods or not?
In other words:
If you set it ON → it shows current levels + levels from previous days/weeks/months
If you set it OFF → it only shows current period levels (meaning it hides any older lines or zones)
Its purpose:
If you want a clean and uncluttered chart — turn it off.
If you want a deeper analysis and to see the history of the levels — turn it on.
🔵 3. fillColorA
This is the color of the "Main Zone A".
This is usually the most important area of the indicator… and is considered the strongest area.
Your choice should be based on:
Strong support/resistance
Recurring demand/supply zone
🔵 4. fillColorB
This is the color of Zone B.
It is usually:
Localities less strong than A
Or support zones
Or a secondary level within the same period
If you don't specify a different color, the indicator uses the same color as A.
🔵 5. fillColorC
This is the color of Zone C. Typically used for:
Strong reversal zones
Danger zones
Or price divergence zones (Warning Zone)
Often shown in red as a warning.
🔵 6. fillColorD
This is the color of the "D" zone.
Usually used for:
Mild support/resistance zones
Or target levels
Or price slippage zones
Its color is green, indicating a positive zone (buy/support).
⭐ System Summary (Very simple and organized)
✔ Show Previous Levels
Turns the display of previous levels on/off.
✔ Fill Color A
Color of primary and strong zones.
✔ Fill Color B
Color of secondary zones.
✔ Fill Color C
Color of warning zones (often strong resistance/danger).
✔ Fill Color D
Color of support/buy/positive zones.
03 - Price Levels
⭐ What is the Price Levels system?
This system is responsible for plotting price levels within the indicator:
Current levels
Previous levels
Colors of the zones
Strength of each level according to its type (A – B – C – D)
This section is essentially the "visual representation" of the zones plotted by the indicator.
⭐ What does this system include?
🔹 1. Show Previous Levels
This option allows you to:
On: Displays levels from previous periods (previous day, previous week, previous month, etc., depending on the indicator's setting).
Off: Displays only the current period's levels, hiding the previous ones for a clean chart.
This is useful for people who:
Like a clean chart → Turn off
Like in-depth analysis and historical levels → Turn on
🔹 2. Colors of Levels A – B – C – D
The system divides the zones into 4 types:
A – Primary color
Strongest zone
Most important level
Most reliable
B – Supportive color
Secondary zone
Less powerful than A
Often within the same period
C – Warning color
Dangerous level or reversal point
Often red because it's a sensitive zone
D – Support/Buy color
Positive level
Often green
System objective:
Each zone type is distinguished by a different color so the reader can immediately identify the zone's strength from the color.
🔹 3. Use Unified Fill (One color for all zones)
This is a new and important option:
✔ If you enable it → all zones (A–B–C–D) will change to the same color
This means the indicator uses only one color for all zones.
Its benefits:
The chart becomes cleaner
The appearance is unified
For users who don't like too many colors
✔ If you turn it off → each level retains its own color
A color
B color
C color
D color
⭐ What is the purpose of this entire system?
The goal is for the indicator to provide:
✔ Clear and organized levels
✔ Complete control over appearance and display
✔ Professional colors that highlight the strength of each area
✔ The ability to merge all levels with a single color if you prefer a simpler look
✔ An option to show/hide previous levels
04 - Trade Settings (Entries / TP / SL)
✅ Trade Settings Explained — A Simple and Clear Guide
This section controls everything related to entry signals, profit targets, stop-loss levels, and filters within the indicator.
The main idea:
🎯 You define what you want to appear on the chart and what you want to hide… and the indicator operates according to your choices.
1️⃣ Show Buy and Sell Signals
Show Buy Signals
If enabled → Buy signals will appear on the chart (arrow, entry line, sticker).
Show Sell Signals
If enabled → Sell signals will appear.
🔸 If disabled → The indicator operates normally, but without entry signals.
2️⃣ Show Profit Targets (TP) and Stop Loss (SL)
Show TP on Chart
If enabled → The indicator draws the target line and displays the TP along with the level.
Show SL on Chart
If enabled → It draws the stop-loss line.
🔹 This means you can leave the signals without TP/SL if you just want to monitor entry without managing the trade.
3️⃣ Stop Appeared Visual Signal
Show "Stop Appeared" Visual
This is a smart option:
Even if you have disabled SL…
it still displays a small indicator that tells you:
"A stop loss appeared on this candle."
🔸 This is useful if you like to keep your chart clean but want to know exactly when the stop loss appears.
4️⃣ Strong Saturation Filter
Enable Saturation Filter
This is an additional filter to prevent weak signals.
If you enable it:
The indicator will only give a signal if the candle is strong, oversaturated, and has high momentum.
This reduces false signals and makes entry more accurate.
🔥 This option is especially important for those trading on lower timeframes.
05 - Alert Settings
✅ Alert Settings Explained
This section covers everything related to the alerts the indicator sends when an entry signal appears.
Its concept is very simple:
🎯 The indicator only alerts you when an entry signal appears… and you choose the type of alert you want to receive.
✔ Enable Simple Entry Alerts
This option is the main toggle.
If you enable it → the indicator sends an alert whenever a buy or sell signal appears.
If you disable it → the indicator operates normally, but without any alerts.
🔸 This option only controls the alert sending; it does not change the indicator's signals themselves.
2️⃣ Alert Type You Want to Receive
✔ Alert Type
Here you choose the type of signals you want the indicator to alert you to:
Buy only → Buy alerts only
Sell only → Sell alerts only
Both → Buy + Sell alerts (default option)
🔸 If you are scalping or focusing on a specific trend, you can limit the alert to only one type to reduce distractions.
In summary, simply and clearly:
The Alerts section allows you to control:
Turn alerts on/off
Choose the type of signals you want to receive: Buy, Sell, or both
This way, you can customize the indicator to alert you in the way that best suits your trading style.
Now that we've covered the basic settings and details of the indicator, I'll explain clearly and simply how stop-loss orders appear, the best timeframes, the best assets to trade, and the best trading times.
1. What is the best timeframe for trading?
According to the D system, the best fixed timeframe for trading is the 15-minute timeframe.
This timeframe provides clear, fast movement, suitable for the nature of the indicator's levels.
2. How does the stop-loss order appear?
The stop-loss order in this system is not fixed, but dynamic.
If a buy signal appears,
and then a candle closes completely below the level,
without the candle returning to touch the level from above,
then the stop-loss order appears immediately.
This is the exit mechanism for the trade in the indicator.
3. What is the best currency or asset to trade?
Based on the D system and the 15-minute timeframe, the best asset to trade is gold,
especially on ONAE, as it provides clear and consistent movement with the indicator.
4. Is it preferable to trade during news releases? I don't recommend trading during news releases, as the market often experiences slippage, which can lead to unexpected losses.
Therefore, pay close attention to high-impact news releases.
5. Can this indicator be used as support and resistance levels for other currencies, stocks, metals, and cryptocurrencies?
Yes, it can be used normally.
However, you must choose the appropriate settings:
Short-term trading → Use the daily setting (D)
Medium-term trading → Use the weekly setting (W)
Long-term trading → Use the monthly setting (M)
Disclaimer
All information mentioned here is based on personal experience and practical observations and does not constitute financial advice or a call to buy or sell. Trading in the financial markets involves high risk and may result in the loss of capital.
Please ensure you fully understand the risks before making any decisions, and use the indicator at your own risk.
Conclusion
This concludes the explanation.
If I have missed any part or have any questions, please write them in the comments, and I will add and clarify all the information completely and accurately.

区间顶底与超级趋势系统Overview:
This is a comprehensive trading system designed to capture both trend reversals and trend-following opportunities. This script combines three core modules: Long-term EMA Tunnels (Vegas Style), Dynamic Support/Resistance Zones (based on historical highs/lows), and the classic SuperTrend. It aims to help traders identify "buy low, sell high" opportunities in ranging markets and catch major waves during strong trends.
Core Features Explained
1. EMA Long-term Trend Tunnel
Configuration: The script includes three specific Exponential Moving Averages (EMAs): 144, 169, and 233.
Function: These lines form a long-term support and resistance band. Price action above these lines is generally considered a bullish trend, while price below indicates a bearish trend.
2. Dynamic Range Top/Bottom
Logic: Calculates the current market structure based on the highest and lowest prices over a specific lookback period (default 130 bars), combined with ATR (Average True Range).
Visualization: Automatically draws Resistance Boxes (Red zone) at the top and Support Boxes (Green zone) at the bottom.
Data Panel: Displays the current ATR volatility percentage and a count of Bullish/Bearish K-lines within the period to help gauge the balance of power between buyers and sellers.
Signals: Reversal arrows appear when price tests these extreme zones and shows signs of rejection.
3. SuperTrend Integration
Tool: A classic trend-following indicator based on ATR and median price.
Usage: Acts as a reliable market noise filter. When SuperTrend is green, it is recommended to look for long setups; when red, look for short setups.
Highlighting: The script supports background highlighting, allowing you to identify the current trend direction at a glance.
How to Use This System
Trend Following Strategy: When the EMA lines are aligned upwards and the SuperTrend shows a Buy signal (Green background), look for long entries on pullbacks to the SuperTrend support line or near the EMAs.
Range Reversal Strategy: When price hits the upper or lower limits of the "Dynamic Range" and a SuperTrend flip or arrow reversal signal occurs, consider counter-trend trades.
Stop Loss: It is recommended to place stop losses just outside the SuperTrend line or the Dynamic Range boxes.
Settings
EMA: You can toggle the visibility of the EMA lines on or off.
Dynamic Range: Customizable lookback period (Length) and extension settings to fit your timeframe.
SuperTrend: Fully adjustable ATR Period and Multiplier to adapt to different asset volatilities.
Disclaimer: This script is for educational purposes only and does not constitute financial advice.
概述:
这是一个专为捕捉趋势反转与顺势交易设计的综合交易系统。本脚本结合了三大核心模块:长期均线隧道(Vegas风格)、动态支撑阻力区间(基于历史高低点)以及经典的超级趋势(SuperTrend)。旨在帮助交易者在震荡行情中识别高抛低吸的机会,并在趋势行情中抓住主升浪。
核心功能解析
1. EMA 长期趋势隧道 (EMA Tunnel)
脚本内置了三条特定的指数移动平均线 (EMA):144、169 和 233。
这些均线构成了长期趋势的支撑与阻力带。当价格位于这些均线之上时,通常视为多头趋势;反之则为空头趋势。
2. 动态顶底区间 (Dynamic Range Top/Bottom)
原理:基于过去一定周期(默认130根K线)内的最高价和最低价,结合 ATR(平均真实波幅)计算出当前的市场结构。
视觉化:图表中会自动绘制出顶部的阻力箱体(红色区域)和底部的支撑箱体(绿色区域)。
数据面板:箱体旁会显示当前的 ATR 波动率百分比,以及该周期内的 K 线买入/卖出计数,帮助判断多空力量对比。
信号:当价格触及这些极限区域并出现反转迹象时,会显示箭头提示。
3. 超级趋势 (SuperTrend)
经典的趋势跟踪工具,基于 ATR 和价格中位数计算。
用法:用于过滤市场噪音。当超级趋势为绿色时,建议只寻找做多机会;为红色时,建议只寻找做空机会。
高亮显示:脚本支持背景高亮,让你一目了然当前的趋势方向。
如何使用本指标进行交易
顺势交易:当 EMA 均线向上排列且 SuperTrend 显示买入信号(绿色背景)时,关注回调至 SuperTrend 支撑线或 EMA 附近的做多机会。
区间反转:当价格触及“动态顶底区间”的上沿或下沿,并且出现 SuperTrend 变色或箭头反转信号时,可考虑反向操作。
止损建议:建议将止损设置在 SuperTrend 线或动态箱体的外侧。
设置说明
你可以开启/关闭 EMA 显示。
可以自定义顶底区间的计算周期(Length)和延伸长度。
可以调整 SuperTrend 的 ATR 周期和乘数以适应不同的波动率。

Smart Money Concepts [XoRonX]# Smart Money Concepts (SMC) - Advanced Trading Indicator
## 📊 Deskripsi
**Smart Money Concepts ** adalah indicator trading komprehensif yang menggabungkan konsep Smart Money Trading dengan berbagai alat teknikal analisis modern. Indicator ini dirancang untuk membantu trader mengidentifikasi pergerakan institusional (smart money), struktur pasar, zona supply/demand, dan berbagai sinyal trading penting.
Indicator ini mengintegrasikan multiple timeframe analysis, order blocks detection, fair value gaps, fibonacci retracement, volume profile, RSI multi-timeframe, dan moving averages dalam satu platform yang powerful dan mudah digunakan.
---
## 🎯 Fitur Utama
### 1. **Smart Money Structure**
- **Internal Structure** - Struktur pasar jangka pendek untuk entry presisi
- **Swing Structure** - Struktur pasar jangka panjang untuk trend analysis
- **BOS (Break of Structure)** - Konfirmasi kelanjutan trend
- **CHoCH (Change of Character)** - Deteksi potensi reversal
### 2. **Order Blocks**
- **Internal Order Blocks** - Zona demand/supply jangka pendek
- **Swing Order Blocks** - Zona demand/supply jangka panjang
- Filter otomatis berdasarkan volatilitas (ATR/Range)
- Mitigation tracking (High/Low atau Close)
- Customizable display (jumlah order blocks yang ditampilkan)
### 3. **Equal Highs & Equal Lows (EQH/EQL)**
- Deteksi otomatis equal highs/lows
- Indikasi liquidity zones
- Threshold adjustment untuk sensitivitas
- Visual lines dan labels
### 4. **Fair Value Gaps (FVG)**
- Multi-timeframe FVG detection
- Auto threshold filtering
- Bullish & Bearish FVG boxes
- Extension control
- Color customization
### 5. **Premium & Discount Zones**
- Premium Zone (75-100% dari range)
- Equilibrium Zone (47.5-52.5% dari range)
- Discount Zone (0-25% dari range)
- Auto-update berdasarkan swing high/low
### 6. **Fibonacci Retracement**
- **Equilibrium to Discount** - Fib dari EQ ke discount zone
- **Equilibrium to Premium** - Fib dari EQ ke premium zone
- **Discount to Premium** - Fib full range
- Reverse option
- Show/hide lines
- Custom colors
### 7. **Volume Profile (VRVP)**
- Visible Range Volume Profile
- Point of Control (POC)
- Value Area (70% volume)
- Auto-adjust rows
- Placement options (Left/Right)
- Width customization
### 8. **RSI Multi-Timeframe**
- Monitor 3 timeframes sekaligus
- Overbought/Oversold signals
- Visual table display
- Color-coded signals (Red OB, Green OS)
- Customizable position & size
### 9. **Moving Averages**
- 3 Moving Average lines
- Pilihan tipe: EMA, SMA, WMA
- Automatic/Manual period mode
- Individual color & width settings
- Cross alerts (MA vs MA, Price vs MA)
### 10. **Multi-Timeframe Levels**
- Support up to 5 different timeframes
- Previous high/low levels
- Custom line styles
- Color customization
### 11. **Candle Color**
- Color candles berdasarkan trend
- Bullish = Green, Bearish = Red
- Optional toggle
---
## 🛠️ Cara Penggunaan
### **A. Setup Awal**
1. **Tambahkan Indicator ke Chart**
- Buka TradingView
- Klik "Indicators" → "My Scripts" atau paste code
- Pilih "Smart Money Concepts "
2. **Pilih Mode Display**
- **Historical**: Tampilkan semua struktur (untuk backtesting)
- **Present**: Hanya tampilkan struktur terbaru (clean chart)
3. **Pilih Style**
- **Colored**: Warna berbeda untuk bullish/bearish
- **Monochrome**: Tema warna abu-abu
---
### **B. Penggunaan Fitur**
#### **1. Smart Money Structure**
**Internal Structure (Real-time):**
- ✅ Aktifkan "Show Internal Structure"
- Pilih tampilan: All, BOS only, atau CHoCH only
- Gunakan untuk entry timing presisi
- Filter confluence untuk mengurangi noise
**Swing Structure:**
- ✅ Aktifkan "Show Swing Structure"
- Pilih tampilan struktur bullish/bearish
- Adjust "Swings Length" (default: 50)
- Gunakan untuk konfirmasi trend utama
**Tips:**
- BOS = Konfirmasi trend continuation
- CHoCH = Warning untuk possible reversal
- Tunggu price retest ke order block setelah BOS
---
#### **2. Order Blocks**
**Setup:**
- ✅ Aktifkan Internal/Swing Order Blocks
- Set jumlah blocks yang ditampil (1-20)
- Pilih filter: ATR atau Cumulative Mean Range
- Pilih mitigation: Close atau High/Low
**Cara Trading:**
1. Tunggu BOS/CHoCH terbentuk
2. Identifikasi order block terdekat
3. Wait for price pullback ke order block
4. Entry saat price respek order block (rejection)
5. Stop loss di bawah/atas order block
6. Target: swing high/low berikutnya
**Color Code:**
- 🔵 Light Blue = Internal Bullish OB
- 🔴 Light Red = Internal Bearish OB
- 🔵 Dark Blue = Swing Bullish OB
- 🔴 Dark Red = Swing Bearish OB
---
#### **3. Equal Highs/Lows (EQH/EQL)**
**Setup:**
- ✅ Aktifkan "Equal High/Low"
- Set "Bars Confirmation" (default: 3)
- Adjust threshold (0-0.5, default: 0.1)
**Interpretasi:**
- EQH = Liquidity di atas, kemungkinan sweep lalu dump
- EQL = Liquidity di bawah, kemungkinan sweep lalu pump
- Biasanya smart money akan grab liquidity sebelum move besar
**Trading Strategy:**
- Wait for EQH/EQL formation
- Anticipate liquidity grab
- Entry setelah sweep dengan konfirmasi (order block, FVG, CHoCH)
---
#### **4. Fair Value Gaps (FVG)**
**Setup:**
- ✅ Aktifkan "Fair Value Gaps"
- Pilih timeframe (default: chart timeframe)
- Enable/disable auto threshold
- Set extension bars
**Cara Trading:**
1. Bullish FVG = Support zone untuk buy
2. Bearish FVG = Resistance zone untuk sell
3. Price tends to fill FVG (retest)
4. Entry saat price kembali ke FVG
5. Partial fill = valid, full fill = invalidated
**Tips:**
- FVG + Order Block = High probability setup
- Multi-timeframe FVG lebih kuat
- Unfilled FVG = strong momentum
---
#### **5. Premium & Discount Zones**
**Setup:**
- ✅ Aktifkan "Premium/Discount Zones"
- Zones akan auto-update berdasarkan swing high/low
**Interpretasi:**
- 🟢 **Discount Zone** = Area BUY (price murah)
- ⚪ **Equilibrium** = Neutral (50%)
- 🔴 **Premium Zone** = Area SELL (price mahal)
**Trading Strategy:**
- BUY dari discount zone
- SELL dari premium zone
- Avoid trading di equilibrium
- Combine dengan structure confirmation
---
#### **6. Fibonacci Retracement**
**Setup:**
- Pilih Fib yang ingin ditampilkan:
- Equilibrium to Discount
- Equilibrium to Premium
- Discount to Premium
- Toggle show lines
- Enable reverse jika perlu
- Custom colors
**Key Levels:**
- 0.236 = Shallow retracement
- 0.382 = Common retracement
- 0.5 = 50% golden level
- 0.618 = Golden ratio (penting!)
- 0.786 = Deep retracement
**Cara Pakai:**
- 0.618-0.786 = Ideal entry zone dalam trend
- Combine dengan order blocks
- Wait for confirmation candle
---
#### **7. Volume Profile (VRVP)**
**Setup:**
- ✅ Aktifkan "Show Volume Profile"
- Set jumlah rows (10-100)
- Adjust width (5-50%)
- Pilih placement (Left/Right)
- Enable POC dan Value Area
**Interpretasi:**
- **POC (Point of Control)** = Harga dengan volume tertinggi = magnet
- **Value Area** = 70% volume = fair price range
- **Low Volume Nodes** = Weak support/resistance
- **High Volume Nodes** = Strong support/resistance
**Trading:**
- POC acts as support/resistance
- Price tends to return to POC
- Breakout dari Value Area = momentum
---
#### **8. RSI Multi-Timeframe**
**Setup:**
- ✅ Aktifkan "Show RSI Table"
- Set 3 timeframes (default: chart, 5m, 15m)
- Set RSI period (default: 14)
- Set Overbought level (default: 70)
- Set Oversold level (default: 30)
- Pilih posisi & ukuran table
**Interpretasi:**
- 🟢 **OS (Oversold)** = RSI ≤ 30 = Kondisi jenuh jual
- 🔴 **OB (Overbought)** = RSI ≥ 70 = Kondisi jenuh beli
- **-** = Neutral zone
**Trading Strategy:**
1. Multi-timeframe alignment = strong signal
2. OS + Bullish structure = BUY signal
3. OB + Bearish structure = SELL signal
4. Divergence RSI vs Price = reversal warning
**Contoh:**
- TF1: OS, TF2: OS, TF3: OS + Price di discount zone = STRONG BUY
---
#### **9. Moving Averages**
**Setup:**
- Pilih MA Type: EMA, SMA, atau WMA (berlaku untuk ketiga MA)
- Pilih Period Mode: Automatic atau Manual
- Set period untuk MA 1, 2, 3 (default: 20, 50, 100)
- Custom color & width per MA
- ✅ Enable Cross Alerts
**Interpretasi:**
- **Golden Cross** = MA fast cross above MA slow = Bullish
- **Death Cross** = MA fast cross below MA slow = Bearish
- Price above all MAs = Strong uptrend
- Price below all MAs = Strong downtrend
**Trading Strategy:**
1. MA1 (20) = Short-term trend
2. MA2 (50) = Medium-term trend
3. MA3 (100) = Long-term trend
**Entry Signals:**
- Price bounce dari MA dalam trend = continuation
- MA cross dengan konfirmasi structure = entry
- Multiple MA confluence = strong support/resistance
**Alerts Available:**
- MA1 cross MA2/MA3
- MA2 cross MA3
- Price cross any MA
---
#### **10. Multi-Timeframe Levels**
**Setup:**
- Enable HTF Level 1-5
- Set timeframes (contoh: 5m, 1H, 4H, D, W)
- Pilih line style (solid/dashed/dotted)
- Custom colors
**Cara Pakai:**
- Previous high/low dari HTF = strong S/R
- Breakout HTF level = significant move
- Multiple HTF levels confluence = major zone
---
### **C. Trading Setup Combination**
#### **Setup 1: High Probability Buy (Bullish)**
1. ✅ Swing structure: Bullish BOS
2. ✅ Price di Discount Zone
3. ✅ Pullback ke Bullish Order Block
4. ✅ Bullish FVG di bawah
5. ✅ RSI Multi-TF: Oversold
6. ✅ Price bounce dari MA
7. ✅ POC/Value Area support
8. ✅ Fibonacci 0.618-0.786 retracement
**Entry:** Saat price reject dari order block dengan confirmation candle
**Stop Loss:** Below order block
**Target:** Swing high atau premium zone
---
#### **Setup 2: High Probability Sell (Bearish)**
1. ✅ Swing structure: Bearish BOS
2. ✅ Price di Premium Zone
3. ✅ Pullback ke Bearish Order Block
4. ✅ Bearish FVG di atas
5. ✅ RSI Multi-TF: Overbought
6. ✅ Price reject dari MA
7. ✅ POC/Value Area resistance
8. ✅ Fibonacci 0.618-0.786 retracement
**Entry:** Saat price reject dari order block dengan confirmation candle
**Stop Loss:** Above order block
**Target:** Swing low atau discount zone
---
#### **Setup 3: Liquidity Grab (EQH/EQL)**
1. ✅ Identifikasi EQH atau EQL
2. ✅ Wait for liquidity sweep
3. ✅ Konfirmasi dengan CHoCH
4. ✅ Order block terbentuk setelah sweep
5. ✅ Entry saat retest order block
---
### **D. Tips & Best Practices**
**Risk Management:**
- Selalu gunakan stop loss
- Risk 1-2% per trade
- Risk:Reward minimum 1:2
- Jangan over-leverage
**Confluence adalah Kunci:**
- Minimal 3-4 konfirmasi sebelum entry
- Lebih banyak konfirmasi = higher probability
- Quality over quantity
**Timeframe Analysis:**
- HTF (Higher Timeframe) = Trend direction
- LTF (Lower Timeframe) = Entry timing
- Align dengan HTF trend
**Backtesting:**
- Gunakan mode "Historical"
- Test strategy di berbagai market condition
- Record dan analyze hasil
**Market Condition:**
- Trending market = Follow BOS, use order blocks
- Ranging market = Use premium/discount zones, EQH/EQL
- High volatility = Wider stops, wait for clear structure
**Avoid:**
- Trading di equilibrium zone
- Entry tanpa konfirmasi
- Fighting the trend
- Overleveraging
- Emotional trading
---
## 📈 Recommended Settings
### **For Scalping (1m - 5m):**
- Internal Structure: ON
- Swing Structure: OFF
- Order Blocks: Internal only
- RSI Timeframes: 1m, 5m, 15m
- MA Periods: 9, 21, 50
### **For Day Trading (15m - 1H):**
- Internal Structure: ON
- Swing Structure: ON
- Order Blocks: Both
- RSI Timeframes: 15m, 1H, 4H
- MA Periods: 20, 50, 100
### **For Swing Trading (4H - D):**
- Internal Structure: OFF
- Swing Structure: ON
- Order Blocks: Swing only
- RSI Timeframes: 4H, D, W
- MA Periods: 20, 50, 200
---
## ⚠️ Disclaimer
Indicator ini adalah alat bantu analisis teknikal. Tidak ada indicator yang 100% akurat. Selalu:
- Lakukan analisa fundamental
- Gunakan proper risk management
- Praktik di demo account terlebih dahulu
- Trading memiliki resiko, trade at your own risk
---
## 📝 Version Info
**Version:** 5.0
**Platform:** TradingView Pine Script v5
**Author:** XoRonX
**Max Labels:** 500
**Max Lines:** 500
**Max Boxes:** 500
---
## 🔄 Updates & Support
Untuk update, bug reports, atau pertanyaan:
- Check documentation regularly
- Test new features in replay mode
- Backup your settings before updates
---
## 🎓 Learning Resources
**Recommended Study:**
1. Smart Money Concepts (SMC) basics
2. Order blocks theory
3. Liquidity concepts
4. ICT (Inner Circle Trader) concepts
5. Volume profile analysis
6. Multi-timeframe analysis
**Practice:**
- Start with higher timeframes
- Master one concept at a time
- Keep a trading journal
- Review your trades weekly
---
**Happy Trading! 🚀📊**
_Remember: The best indicator is your own analysis and discipline._

Adaptive Trend & Momentum [ATM] - All-in-One Confirmation Tired of Cluttered Charts and Conflicting Signals? This All-in-One Indicator is Your Solution.
The Adaptive Trend & Momentum (ATM) indicator is a powerful, next-generation trading tool designed to eliminate chart clutter and provide clear, high-conviction signals. Instead of using multiple conflicting indicators, the ATM system combines trend, momentum, and volatility into a single, cohesive, and adaptive framework. It automatically adjusts to changing market conditions, giving you a reliable edge in any environment.
This is not just another moving average crossover. It is a complete trading system that helps you identify the trend, confirm its strength, and time your entries with precision.
Key Features
•
Adaptive Moving Average (AMA): The core of the system. The AMA automatically adjusts its length based on market volatility (using the Average True Range). It becomes faster and more responsive in volatile markets to catch moves early, and smoother in calm markets to avoid noise and false signals.
•
Dynamic Volatility Bands: These bands expand and contract based on market volatility, providing a dynamic map of support and resistance. They are crucial for identifying pullback opportunities and setting effective stop-loss levels.
•
Integrated Momentum Oscillator: A smoothed RSI-based oscillator that runs in a separate pane. It is designed to confirm the signals from the main chart. The oscillator and its histogram are color-coded to show whether bullish or bearish momentum is in control, giving you an instant read on market strength.
•
Clear Consensus Signals: The ATM indicator provides four distinct, easy-to-read signals directly on your chart:
•
STRONG BUY: The highest-conviction signal, appearing when the trend is bullish, momentum is bullish, and the price has pulled back to a strategic entry zone near the AMA.
•
BUY: A standard confirmation signal when both trend and momentum are aligned to the upside.
•
STRONG SELL: The highest-conviction short signal, appearing when the trend is bearish, momentum is bearish, and the price has rallied to a strategic entry zone.
•
SELL: A standard confirmation signal when both trend and momentum are aligned to the downside.
•
Real-Time Dashboard: A convenient on-chart table that provides a complete overview of the market at a glance. It shows the current adaptive length, trend direction, momentum status, consensus signal, and volatility percentage, so you always know what the indicator is thinking.
How It Works: The Adaptive Engine
The magic of the ATM indicator lies in its adaptive engine. Traditional moving averages use a fixed length (e.g., 50-period MA), which can be too slow in a fast market or too sensitive in a choppy one. The ATM’s Adaptive Moving Average solves this by dynamically adjusting its calculation period in real-time:
When volatility increases, the AMA shortens its length to react more quickly to price changes. When volatility decreases, it lengthens its period to smooth out noise and prevent false signals.
This adaptive nature ensures that the indicator remains relevant and effective across different assets and timeframes, from scalping to swing trading.
How to Use This Indicator: A Simple Trading Strategy
The ATM indicator is designed for clarity and ease of use. Here is a basic framework for trading with it:
For Long (Buy) Positions:
1.
Identify the Trend: Wait for the Adaptive Moving Average (AMA) line to turn green, indicating a confirmed uptrend.
2.
Confirm with Momentum: Check that the momentum oscillator is above 50 and preferably rising, confirming bullish strength.
3.
Find Your Entry: The best entry is a "STRONG BUY" signal. This tells you that the price has pulled back to a value area within the uptrend, offering a high-probability entry. A standard "BUY" signal can also be used, but the conviction is higher on "STRONG" signals.
4.
Set Your Stop-Loss: A logical place for a stop-loss is just below the lower volatility band.
5.
Take Profit: Consider taking profits when an opposing "SELL" or "STRONG SELL" signal appears, or when the price reaches a key resistance level.
For Short (Sell) Positions:
1.
Identify the Trend: Wait for the Adaptive Moving Average (AMA) line to turn red, indicating a confirmed downtrend.
2.
Confirm with Momentum: Check that the momentum oscillator is below 50 and preferably falling, confirming bearish strength.
3.
Find Your Entry: The best entry is a "STRONG SELL" signal. This indicates the price has rallied to a resistance area within the downtrend, offering a prime shorting opportunity. A standard "SELL" signal can also be used.
4.
Set Your Stop-Loss: A logical place for a stop-loss is just above the upper volatility band.
5.
Take Profit: Consider taking profits when an opposing "BUY" or "STRONG BUY" signal appears, or when the price reaches a key support level.
Customization and Settings
The indicator is fully customizable to fit your trading style and the asset you are trading. You can adjust:
•
AMA Settings: Control the base length and the volatility multiplier to make the indicator more or less sensitive.
•
Momentum Settings: Adjust the RSI length and smoothing for the oscillator.
•
Volatility Bands: Change the multiplier to widen or narrow the bands.
•
Visuals: Toggle signals, labels, and the dashboard on or off, and customize all colors to your preference.
Summary
The Adaptive Trend & Momentum (ATM) indicator is more than just a tool; it is a complete system for making more confident trading decisions. By adapting to the market and combining trend, momentum, and volatility, it provides a clear, uncluttered, and powerful view of price action.
Add it to your chart today and experience the clarity of adaptive trading!
Disclaimer: This indicator is a tool for technical analysis and should not be considered financial advice. Trading involves risk, and you should always use proper risk management. Past performance is not indicative of future results. Practice on a demo account before trading with real capital.
Keywords: Adaptive, Moving Average, Trend, Momentum, Volatility, RSI, Bands, Signal, Confirmation, All-in-One, System, Strategy, ATR, Volatility, Dashboard, Alert

RED-E Gamma Range DetectorRED-E Gamma Range Detector
Overview
The RED-E Gamma Range Detector identifies key support and resistance zones based on recent price action and volume distribution, combined with a simple momentum ribbon to help traders visualize trend direction. It's designed to highlight potential areas where price may react, inspired by the concept of gamma exposure levels in options trading.
How It Works
1. Support & Resistance Zones (Green & Red Boxes)
RED-E analyzes the recent price range over a customizable lookback period
It identifies high-probability support levels (green boxes) below current price
It identifies high-probability resistance levels (red boxes) above current price
These zones represent areas where price has historically shown increased activity
2. Gamma Flip Level (Yellow Dashed Line)
The yellow line represents the approximate "gamma flip" - the midpoint of the recent range
Above this line: Price tends to be more stable with range-bound behavior
Below this line: Price tends to be more volatile with trending behavior
This level acts as a key pivot point for market structure
3. Momentum Ribbon (Green/Red Fill)
A simple visual indicator using 9 and 21 period EMAs
Green ribbon: 9 EMA is above 21 EMA (bullish momentum)
Red ribbon: 9 EMA is below 21 EMA (bearish momentum)
Ribbon width shows strength of trend (wider = stronger trend)
How to Use
For Range Trading:
Look for buy signals near green support zones when above gamma flip
Look for sell signals near red resistance zones when above gamma flip
Price tends to bounce between zones in stable conditions
For Trend Trading:
Watch for breakouts above resistance or below support zones
Use the momentum ribbon to confirm trend direction
Wider ribbon gaps indicate stronger directional moves
For Risk Management:
Use support/resistance zones for stop-loss placement
Recognize increased volatility potential below the gamma flip
Adjust position sizing based on your proximity to key zones
Settings
Lookback Period: Number of bars to analyze (default: 20)
Lower values = more responsive to recent price action
Higher values = more stable, longer-term levels
Best Practices
Works best on liquid instruments (major stocks, indices, forex pairs)
Combine with other technical analysis tools for confirmation
Most effective on 1H, 4H, and daily timeframes
Always use proper risk management and stop losses
Why "RED-E"?
RED-E stands for being Ready to identify critical gamma levels, support/resistance zones, and momentum shifts - keeping you prepared for market moves before they happen.
Educational Note
This indicator approximates gamma exposure concepts using price and volume analysis. It does not use actual options data. The term "gamma" refers to the rate of change in options delta and how market makers hedge their positions, which can create support/resistance at certain price levels.
Disclaimer
This indicator is for educational and informational purposes only. It does not guarantee profitable trades. Past performance is not indicative of future results. Always conduct your own analysis and manage risk appropriately. Trading involves substantial risk of loss.
Recommended Categories
Primary Category:
✅ Support and Resistance
Secondary Categories:
✅ Momentum
✅ Trend Analysis
✅ Volatility

Atif's Liquidity Toolkit💎 GENERAL OVERVIEW:
Atif’s Liquidity Toolkit is a price-action-based indicator used to identify Buyside & Sellside Liquidity Levels, Liquidity Sweeps, FVG Sweeps, and Buy/Sell signals, following specific rules from Atif Hussain.
This indicator was developed by Flux Charts in collaboration with Atif Hussain.
🔹Purpose of this indicator:
The purpose of Atif’s Liquidity Toolkit is to help traders understand where liquidity is forming, when it’s being taken, and how momentum shifts immediately afterward. It automates the entire process of identifying buyside & sellside liquidity, detecting liquidity sweeps, and confirming whether displacement followed through a Fair Value Gap. The goal is to give traders a consistent, rule-based framework to interpret market structure.
🎯ATIF’S LIQUIDITY TOOLKIT FEATURES:
Atif’s Liquidity Toolkit indicator includes 6 main features:
Fair Value Gaps
Multi-Timeframe Liquidity Levels
Liquidity Sweeps
Fair Value Gap Sweeps
Buy & Sell Signals with Take-Profit & Stop-Loss Levels
Alerts
1️⃣Fair Value Gaps
🔹What is a Fair Value Gap?:
A Fair Value Gap (FVG) is an area where the market’s perception of fair value suddenly changes. On your chart, it appears as a three-candle pattern: a large candle in the middle, with smaller candles on each side that don’t fully overlap it. A bullish FVG forms when a bullish candle is between two smaller bullish/bearish candles, where the first and third candles’ wicks don’t overlap each other at all. A bearish FVG forms when a bearish candle is between two smaller bullish/bearish candles, where the first and third candles’ wicks don’t overlap each other at all.
Bullish & Bearish FVGs:
In the settings, you can toggle on/off FVGs, choose the invalidation method, adjust the sensitivity, and toggle on FVG Midline & Labels.
🔹Invalidation Method:
The Invalidation Method setting allows traders to choose how an FVG is invalidated. You can choose between Close and Wick.
Close: A candle must close below a bullish FVG or above a bearish FVG to invalidate it.
Wick: A candle’s wick must go below a bullish FVG or above a bearish FVG to invalidate it.
🔹Sensitivity:
The sensitivity setting determines the minimum gap size required for an FVG detection. A higher sensitivity will filter out smaller gaps, while a lower sensitivity will detect more frequent, smaller gaps. Setting the sensitivity to 0 will display all gaps, regardless of their size.
On the left, the sensitivity is 5. On the right, the sensitivity is 0.
🔹Midline:
When enabled, a dashed line is drawn at the center of the FVG.
🔹Labels:
When enabled, a text label will be plotted with the gap, clearly identifying the zone as a FVG.
2️⃣ Multi-Timeframe Liquidity Levels
The indicator automatically detects and plots Buyside Liquidity (BSL) & Sellside Liquidity (SSL) Levels across up to three timeframes simultaneously.
🔹What is Buyside Liquidity?
Buyside Liquidity (BSL) represents price levels where many buy stop orders are sitting, usually from traders holding short positions. When price moves into these areas, those stop-loss orders get triggered and short sellers are forced to buy back their positions. These zones often form above key highs such as the previous day, week, or month. Understanding BSL is important because when price reaches these levels, the sudden wave of buy orders can create sharp reactions or reversals as liquidity is taken from the market.
🔹What is Sellside Liquidity?
Sellside Liquidity (SSL) represents price levels where many sell stop orders are waiting, usually from traders holding long positions. When price drops into these areas, those stop-loss orders are triggered and long traders are forced to sell their positions. These zones often form below key lows such as the previous day, week, or month. Understanding SSL is important because when price reaches these levels, the surge of sell orders can cause sharp reactions or reversals as liquidity is taken from the market.
Atif’s Liquidity Toolkit indicator automatically plots Buyside & Sellside Liquidity levels using the following levels:
Previous Day High (PDH) & Previous Day Low (PDL)
Previous Week High (PWH) & Previous Week Low (PWL)
Previous Month High (PMH) & Previous Month Low (PML)
Asia Session Highs/Lows
London Session Highs/Lows
New York Session Highs/Lows
The session start and end times are not customizable. The following times in EST are used for each session:
Asia Session: 20:00-00:00
London Session: 02:00-05:00
New York Sessions:
NY AM: 09:30-11:00
NY Lunch: 12:00-13:00
NY PM: 14:00-16:00
Users can also plot swing highs/lows using a lookback period and choosing the higher timeframe. Users can choose two custom higher timeframes and also enable swing highs/lows from the current chart’s timeframe.
There are three settings to customize for the current chart’s timeframe and higher timeframes:
Current TF - when toggled on, swing highs/lows will be plotted from the chart’s timeframe using the pivot length input
HTF 1 - when toggled on, swing highs/lows will be plotted from the user-inputted timeframe using the pivot length input
HTF 2 - when toggled on, swing highs/lows will be plotted from the user-inputted timeframe using the pivot length input
The Pivot Length controls how far back the indicator checks to confirm whether a candle’s high or low is a true swing point (also called a “pivot”). When detecting a swing high, the indicator checks if that candle’s high is higher than the highs of the previous X candles and the next X candles. For a swing low, it checks if the candle’s low is lower than the lows of the previous X candles and the next X candles. The number X comes from your Pivot Length setting.
A lower Pivot Length input (for example, 3 or 4) means the indicator only looks at a few candles on each side, so it will detect more swing points, including smaller, less significant ones. A higher Pivot Length input (for example, 20 or 25) makes the indicator look at more candles on each side, so it only marks major turning points that stand out clearly on the chart.
In short:
Low Pivot Length = more frequent, smaller levels (short-term focus)
High Pivot Length = fewer, stronger levels (major swing focus)
The Pivot Length input for each setting (Current TF, HTF 1, and HTF 2) are displayed below in the red boxes:
Each liquidity level is plotted with a text label, making it easy to identify where a level came from. You can turn off the ‘Show Levels’ setting if you don’t want to see the levels on your chart.
Please note: Liquidity Levels play a key role in finding liquidity sweeps, FVG Sweeps, and Buy/Sell signals. Keeping the levels turned off will not stop the indicator from using the levels that are enabled from being used for the other features mentioned.
3️⃣Liquidity Sweeps:
The indicator automatically detects bullish and bearish liquidity sweeps using the liquidity levels you have enabled.
🔹What is a Liquidity Sweep?
A liquidity sweep is a market phenomenon where significant players, such as institutional traders, deliberately drive prices through key levels to trigger clusters of pending buy or sell orders. It’s how the market gathers the liquidity needed for larger participants to enter positions.
Traders often place stop-loss orders around obvious highs and lows, such as the previous day’s, week’s, or month’s levels. When price pushes through one of these areas, it triggers the stops placed there and generates a burst of volume. This often creates a short-term fake-out before the market reverses in the opposite direction.
By detecting these sweeps in real time, traders can identify potential reversal areas or “trap” areas where liquidity has been taken.
🔹Bullish Liquidity Sweep
These occur when price dips below a Sellside Liquidity (SSL) level, taking out the stop-loss orders placed by long traders below that low. The indicator marks a zone around the candle that swept the SSL to highlight where liquidity was removed from the market.
When this happens, it shows that the market just cleared out sell-side liquidity, meaning traders who were long had their stops hit. This is often followed by a reversal or strong reaction upward, because the market no longer has pending liquidity to fill below that level.
🔹Bearish Liquidity Sweep
These occur when price dips above a Buyside Liquidity (BSL) level, taking out the stop-loss orders placed by short seller traders above that high. The indicator marks a zone around the candle that swept the BSL to highlight where liquidity was removed from the market.
When this happens, it shows that the market just cleared out buyside liquidity, meaning short traders had their stops hit. This is often followed by a reversal or strong reaction downward, because the market no longer has pending liquidity to fill above that level.
Under the ‘Liquidity Sweeps’ section in the settings, you can toggle on/off Bullish Regular Sweeps and Bearish Regular Sweeps. You can also customize the line style and color of liquidity levels that have been swept.
🔹How to Use Liquidity Sweeps
Liquidity sweeps are not direct trade signals. They are best used as context when forming a directional bias. A sweep shows that the market has removed liquidity from one side, which can hint at where the next move may develop.
For example:
When Buyside Liquidity (BSL) is swept, it often signals that buy stops have been triggered and the market may be preparing to move lower. Traders may then begin looking for short opportunities.
When Sellside Liquidity (SSL) is swept, it often signals that sell stops have been triggered and the market may be preparing to move higher. Traders may then begin looking for long opportunities.
It’s common practice to use liquidity sweeps as the first step in building a trade idea. Many traders will wait for additional confirmation, such as a fair value gap forming after the sweep, before opening a position.
Under the ‘Liquidity Sweeps’ section in the settings, you can toggle on/off:
Bullish Regular Sweeps - when disabled, Bullish Regular Sweeps won’t appear on your chart.
Bearish Regular Sweeps - when disabled, Bearish Regular Sweeps won’t appear on your chart.
4️⃣Fair Value Gap Sweeps:
The indicator automatically detects bullish and bearish Fair Value Gap sweeps (FVG Sweep) using the liquidity levels you have enabled.
🔹What is a FVG Sweep?
A FVG Sweep is a specific type of liquidity sweep that not only clears liquidity above or below a key level, but also forms a Fair Value Gap (FVG) immediately afterward.
The liquidity sweep shows where stop orders were triggered, areas where the market aggressively took out one side’s liquidity. The formation of a Fair Value Gap right after the sweep confirms that displacement followed. This means that the sweep was not just a stop hunt, but a deliberate move backed by momentum.
In simple terms, a regular liquidity sweep only tells you that liquidity was taken. A FVG Sweep tells you that liquidity was taken and a strong directional move started immediately after, leaving an imbalance in price. That imbalance represents where aggressive buyers or sellers entered the market without enough opposite-side orders to keep price balanced. This combination adds a confirmation and intent behind regular liquidity sweeps.
🔹Bullish FVG Sweep
The indicator automatically detects bullish FVG Sweeps when price takes out a Sellside Liquidity (SSL) level and then forms a bullish FVG within the next few candles. This sequence shows that sellers were stopped out and buyers immediately entered the market with momentum.
🔹Bearish FVG Sweep
The indicator automatically detects bearish FVG Sweeps when price takes out a Buyside Liquidity (BSL) level and then forms a bearish FVG shortly after. This shows that short sellers’ stops were triggered, and new selling pressure entered the market right away.
🔹How to Use FVG Sweeps
Unlike regular liquidity sweeps, FVG Sweeps can be used as trade entries because they confirm both liquidity being cleared and immediate momentum. A regular sweep only shows that stop-losses were triggered, but an FVG Sweep proves that price not only cleared liquidity but also moved away with momentum, leaving behind an imbalance (Fair Value Gap). This shift often marks the start of a new short-term trend.
We’ll cover this in more detail in the Buy and Sell Signal section below, but in short, a bullish FVG Sweep can act as confirmation for a potential long entry after price takes out a low, while a bearish FVG Sweep can confirm a short entry after price takes out a high.
The strongest FVG Sweeps come from extremely sharp reversals. On the chart, they look like a “V” shape for bullish setups or an inverted “V” shape for bearish setups. This shape shows how quickly momentum shifted after liquidity was cleared. When price instantly reverses and leaves a Fair Value Gap behind, it’s a clear sign that buyers or sellers stepped in aggressively and absorbed all available liquidity on the opposite side.
In practice, traders often use FVG Sweeps as a trigger to align their bias. For example, after a bullish FVG Sweep, the focus shifts toward looking for long setups within the new imbalance or during a small retracement into the Fair Value Gap. After a bearish FVG Sweep, traders focus on short setups as price retraces back into the gap before continuing lower. The key takeaway is that FVG Sweeps show conviction.
Under the ‘Liquidity Sweeps’ section in the settings, you can toggle on/off:
Bullish FVG Sweeps - when disabled, Bullish FVG Sweeps won’t appear on your chart.
Bearish FVG Sweeps - when disabled, Bearish FVG Sweeps won’t appear on your chart.
Please Note: the settings you choose to use for Fair Value Gaps, under the ‘Fair Value Gaps’ section, will be used for FVG Sweeps. This is important because if you increase the sensitivity value for FVGs, not all FVG Sweeps will appear if the FVG’s size doesn’t meet the sensitivity threshold.
5️⃣Buy & Sell Signals:
This indicator also plots Buy & Sell signals. These signals follow logic based on Atif Hussain’s FVG trading model. The entry requirements for a Long & Short signal are outlined below.
🔹Buy Signal:
In order for a Buy Signal to generate, the following conditions must occur in order:
Bullish FVG Sweep
Price Retraces to the Bullish FVG
🔹Sell Signal:
In order for a Buy Signal to generate, the following conditions must occur in order:
Bearish FVG Sweep
Price Retraces to the FVG
🔹Require Retracement:
Under the ‘Signals’ section in the settings, you can toggle on/off the ‘Require Retracement’ setting. When disabled, a long/short signal will appear immediately after a Bullish or Bearish FVG Sweep, instead of waiting for price to retrace back to the gap.
Please Note: the liquidity levels you enable under the ‘Liquidity Levels’ section will be the levels used for signals. Thus, if you only have the Previous Day Highs/Lows enabled, then only those levels will be used to generate buy/sell signals. Also, long Signals will only appear if Bullish FVG Sweeps are enabled, and Short Signals will only appear if Bearish FVG Sweeps are enabled.
When a Buy Signal or Sell Signal is plotted, three suggested take-profit levels and one suggested stop-loss level are plotted. There are two different Take-Profit methods you can choose from within the indicator settings: Manual or Auto.
🔹Manual Take-Profit:
If you’re using manual take-profit levels, you can customize the Risk-to-Reward (RR) for Take-Profit 1, 2, and 3 by adjusting the “RR 1”, “RR 2”, and “RR 3” settings. Setting RR 1 to 1 means take-profit 1 is a 1:1 risk-to-reward ratio. The stop-loss will always be placed at the recent low for Buy Signals, and at the recent high for Sell Signals.
🔹Auto Take-Profit:
If you select to use Auto Take-Profit instead of Manual, then Take-Profit 1, 2, and 3 will be automatically determined based on nearby liquidity levels. The stop-loss will be placed at the recent low for Buy Signals, and at the recent high for Sell Signals. Take-Profit Levels 1, 2, and 3 will be placed at the three closest opposite liquidity levels. If the take-profit 2 and take-profit 3 levels are too far away, only one take-profit level will be displayed.
🔹Signal Settings:
Long Signals:
When enabled, long signals are shown. When disabled, long signals will not appear.
Short Signals:
When enabled, short signals are shown. When disabled, short signals will not appear.
Require Retracement:
When enabled, price must retrace to a FVG after a FVG Sweep in order for a signal to be generated.
Take-Profit Levels:
When enabled, take-profit levels (TP 1, TP 2, and TP 3) are shown with long/short signals. When disabled, take-profit levels and their price labels are not displayed.
Take-Profit Labels:
When enabled, take-profit labels are displayed when price reaches one of the three take-profit levels. When disabled, labels won’t appear when price reaches take-profit levels.
Stop-Loss Levels:
When enabled, stop-loss levels are shown for long/short signals. When disabled, the stop-loss level and its price label are not displayed.
Stop-Loss Labels:
When enabled, stop-loss levels are shown for long/short signals. When disabled, a label won’t appear when price reaches the stop-loss level.
6️⃣Alerts:
The indicator supports alerts, so you never miss a key market move. You can choose to receive alerts for each of the following conditions:
Bearish Liquidity Sweep
Bullish Liquidity Sweep
Bearish FVG Sweep
Bullish FVG Sweep
Long Signal
Short Signal
TP 1
TP 2
TP 3
Stop-Loss
‼️Important Notes:
TradingView has limitations when running features on multiple timeframes, such as the liquidity levels, which can result in the following error:
🔹Computation Error:
The computation of using MTF features are very intensive on TradingView. This can sometimes cause calculation timeouts. When this occurs, simply force the recalculation by modifying one indicator’s settings or by removing the indicator and adding it to your chart again.
🚩 UNIQUENESS:
This indicator is unique because it identifies a specific type of liquidity event referred to as FVG Sweeps, where price takes liquidity and then immediately forms a Fair Value Gap in the opposite direction. These FVG Sweeps serve as the foundation of the model, and the script uses them as the required condition for generating Buy and Sell signals. Once an FVG Sweep is confirmed, the indicator automatically produces a fully defined trade idea with a stop-loss and up to three take-profit targets, following a consistent rule-based execution approach.

Pinbar MTF - No Repaint# Pinbar MTF - No Repaint Indicator
## Complete Technical Documentation
---
## 📊 Overview
**Pinbar MTF (Multi-Timeframe) - No Repaint** is a professional-grade TradingView Pine Script indicator designed to detect high-probability pinbar reversal patterns with advanced filtering systems. The indicator is specifically engineered to be **100% non-repainting**, making it reliable for both live trading and backtesting.
### Key Features
✅ **Non-Repainting** - Signals only appear AFTER bar closes, never disappear
✅ **Three-Layer Filter System** - ATR, SWING, and RSI filters
✅ **Automatic SL/TP Calculation** - Based on risk:reward ratios
✅ **Real-time Alerts** - TradingView notifications for all signals
✅ **Visual Trade Management** - Lines, labels, and areas for entries, stops, and targets
✅ **Backtesting Ready** - Reliable historical data for strategy testing
---
## 🎯 What is a Pinbar?
A **Pinbar (Pin Bar/Pinocchio Bar)** is a single candlestick pattern that indicates a potential price reversal:
### Bullish Pinbar (BUY Signal)
- **Long lower wick** (rejection of lower prices)
- **Small body at the top** of the candle
- Shows buyers rejected sellers' attempt to push price down
- Forms at support levels or swing lows
- Entry signal for LONG positions
### Bearish Pinbar (SELL Signal)
- **Long upper wick** (rejection of higher prices)
- **Small body at the bottom** of the candle
- Shows sellers rejected buyers' attempt to push price up
- Forms at resistance levels or swing highs
- Entry signal for SHORT positions
---
## 🔧 How the Indicator Works
### 1. **Pinbar Detection Logic**
The indicator analyzes the **previous closed bar ** to identify pinbar patterns:
```
Bullish Pinbar Requirements:
- Lower wick > 72% of total candle range (adjustable)
- Upper wick < 28% of total candle range
- Close > Open (bullish candle body)
Bearish Pinbar Requirements:
- Upper wick > 72% of total candle range (adjustable)
- Lower wick < 28% of total candle range
- Close < Open (bearish candle body)
```
**Why check ?** By analyzing the previous completed bar, we ensure the pattern is fully formed and won't change, preventing repainting.
---
### 2. **Three-Layer Filter System**
#### 🔍 **Filter #1: ATR (Average True Range) Filter**
- **Purpose**: Ensures the pinbar has significant size
- **Function**: Only signals if pinbar range ≥ ATR value
- **Benefit**: Filters out small, insignificant pinbars
- **Settings**:
- Enable/Disable toggle
- ATR Period (default: 7)
**Example**: If ATR = 50 pips, only pinbars with 50+ pip range will signal.
---
#### 🔍 **Filter #2: SWING Filter** (Always Active)
- **Purpose**: Confirms pinbar forms at swing highs/lows
- **Function**: Validates the pinbar is an absolute high/low
- **Benefit**: Identifies true reversal points
- **Settings**:
- Swing Candles (default: 3)
**How it works**:
- For bullish pinbar: Checks if low is lowest of past 3 bars
- For bearish pinbar: Checks if high is highest of past 3 bars
**Example**: With 3 swing candles, a bullish pinbar must have the lowest low among the last 3 bars.
---
#### 🔍 **Filter #3: RSI (Relative Strength Index) Filter**
- **Purpose**: Confirms momentum conditions
- **Function**: Prevents signals in extreme momentum zones
- **Benefit**: Avoids counter-trend trades
- **Settings**:
- Enable/Disable toggle
- RSI Period (default: 7)
- RSI Source (Close, Open, High, Low, HL2, HLC3, OHLC4)
- Overbought Level (default: 70)
- Oversold Level (default: 30)
**Logic**:
- Bullish Pinbar: Only signals if RSI < 70 (not overbought)
- Bearish Pinbar: Only signals if RSI > 30 (not oversold)
---
### 3. **Stop Loss Calculation**
Two methods available:
#### Method A: ATR-Based Stop Loss (Recommended)
```
Bullish Pinbar:
SL = Pinbar Low - (1 × ATR)
Bearish Pinbar:
SL = Pinbar High + (1 × ATR)
```
**Benefit**: Dynamic stops that adapt to market volatility
#### Method B: Fixed Pips Stop Loss
```
Bullish Pinbar:
SL = Pinbar Low - (Fixed Pips)
Bearish Pinbar:
SL = Pinbar High + (Fixed Pips)
```
**Settings**:
- Calculate Stop with ATR (toggle)
- Stop Pips without ATR (default: 5)
---
### 4. **Take Profit Calculation**
Take Profit is calculated based on Risk:Reward ratio:
```
Bullish Trade:
TP = Entry + (Entry - SL) × Risk:Reward Ratio
Bearish Trade:
TP = Entry - (SL - Entry) × Risk:Reward Ratio
```
**Example**:
- Entry: 1.2000
- SL: 1.1950 (50 pip risk)
- RR: 2:1
- TP: 1.2100 (100 pip reward = 50 × 2)
**Settings**:
- Risk:Reward Ratio (default: 1.0, range: 0.1 to 10.0)
---
## 📈 Visual Elements
### On-Chart Displays
1. **Signal Markers**
- 🟢 **Green Triangle Up** = Bullish Pinbar (BUY)
- 🔴 **Red Triangle Down** = Bearish Pinbar (SELL)
- Placed directly on the pinbar candle
2. **Entry Labels**
- Green "BUY" label with entry price
- Red "SELL" label with entry price
- Shows exact entry level
3. **Stop Loss Lines**
- 🔴 Red horizontal line
- "SL" label
- Extends 20 bars forward
4. **Take Profit Lines**
- 🟢 Green horizontal line
- "TP" label
- Extends 20 bars forward
5. **Risk/Reward Areas** (Optional)
- Red shaded box = Risk zone (Entry to SL)
- Green shaded box = Reward zone (Entry to TP)
- Visual risk:reward visualization
6. **Info Table** (Top Right)
- Displays current settings
- Shows filter status (ON/OFF)
- Real-time RSI value
- Quick reference panel
---
## 🔔 Alert System
Three alert types available:
### 1. Combined Alert: "Pinbar Signal (Any Direction)"
- Fires for BOTH bullish and bearish pinbars
- **Best for**: General monitoring
- **Message**: "Pinbar Signal Detected on {TICKER} at {PRICE}"
### 2. Bullish Alert: "Bullish Pinbar Alert"
- Fires ONLY for BUY signals
- **Best for**: Long-only strategies
- **Message**: "BUY Signal on {TICKER} at {PRICE}"
### 3. Bearish Alert: "Bearish Pinbar Alert"
- Fires ONLY for SELL signals
- **Best for**: Short-only strategies
- **Message**: "SELL Signal on {TICKER} at {PRICE}"
---
## ⚙️ Input Parameters Reference
### **Filters Group**
| Parameter | Default | Range | Description |
|-----------|---------|-------|-------------|
| ATR Filter on Pinbar Range? | ✅ ON | Boolean | Enable/disable ATR filter |
| ATR Period | 7 | 1+ | Lookback period for ATR calculation |
| Swing Candles | 3 | 1+ | Bars to check for swing high/low |
| RSI Filter on Pinbar? | ❌ OFF | Boolean | Enable/disable RSI filter |
| RSI Period | 7 | 2+ | Lookback period for RSI calculation |
| RSI Source | Close | Multiple | Price data for RSI (Close/Open/High/Low/etc) |
| RSI Overbought Level | 70 | 50-100 | Upper threshold for RSI filter |
| RSI Oversold Level | 30 | 0-50 | Lower threshold for RSI filter |
### **Pinbar Detection Group**
| Parameter | Default | Range | Description |
|-----------|---------|-------|-------------|
| Shadow % vs Body | 72 | 50-95 | Minimum wick size as % of total range |
### **Visualization Group**
| Parameter | Default | Range | Description |
|-----------|---------|-------|-------------|
| Show SL and TP Lines? | ✅ ON | Boolean | Display stop loss and take profit lines |
| Show SL and TP Area? | ❌ OFF | Boolean | Show shaded risk/reward boxes |
### **Risk Management Group**
| Parameter | Default | Range | Description |
|-----------|---------|-------|-------------|
| Risk:Reward Ratio | 1.0 | 0.1-10.0 | Target profit vs risk (1.0 = 1:1, 2.0 = 1:2) |
| Calculate Stop with ATR? | ✅ ON | Boolean | Use ATR for stop calculation |
| Stop Pips without ATR | 5 | 1+ | Fixed pip stop when ATR disabled |
---
## 🚫 Non-Repainting Architecture
### What is Repainting?
**Repainting** occurs when an indicator's historical signals differ from what appeared in real-time. This makes backtesting unreliable and can lead to false confidence in a strategy.
### How This Indicator Prevents Repainting
1. **Closed Bar Analysis**
- All calculations use ` ` offset (previous bar)
- Only analyzes COMPLETED candles
- Signals appear on the bar AFTER the pinbar closes
2. **Confirmed Swing Points**
- Waits for sufficient bar history before signaling
- Only checks historical bars that cannot change
- Prevents premature swing detection
3. **Static Alert Timing**
- Alerts fire only after bar completion
- No conditional logic that changes historically
- Same results in replay mode and live trading
### Verification Method
To verify non-repainting behavior:
1. Apply indicator to chart
2. Note signal locations and prices
3. Refresh browser / reload chart
4. **Signals remain in exact same locations**
---
## 💼 Trading Strategy Guidelines
### Entry Rules
**For Bullish Pinbar (LONG):**
1. Wait for green triangle to appear
2. Enter at close of pinbar (shown in label)
3. Alternative: Enter on break of pinbar high
4. Place stop loss at red SL line
5. Set target at green TP line
**For Bearish Pinbar (SHORT):**
1. Wait for red triangle to appear
2. Enter at close of pinbar (shown in label)
3. Alternative: Enter on break of pinbar low
4. Place stop loss at red SL line
5. Set target at green TP line
### Risk Management
- **Position Sizing**: Risk only 1-2% of account per trade
- **Stop Loss**: Always use the calculated SL (never move it wider)
- **Take Profit**: Use calculated TP or trail stop after 1:1 RR
- **Multiple Timeframes**: Confirm signals on higher timeframe
### Best Practices
✅ **DO:**
- Wait for bar to close before entering
- Trade in direction of higher timeframe trend
- Use on liquid markets with clear support/resistance
- Combine with price action analysis
- Keep a trading journal
❌ **DON'T:**
- Enter before bar closes (prevents seeing full pattern)
- Trade against strong trends
- Ignore the filters (they improve win rate)
- Risk more than 2% per trade
- Trade every signal (be selective)
---
## 📊 Backtesting & Data Export
### Available Data Points
The indicator exports these values for strategy development:
| Output | Description |
|--------|-------------|
| Bullish Signal | 1 = BUY signal, 0 = No signal |
| Bearish Signal | 1 = SELL signal, 0 = No signal |
| Bull SL | Stop loss level for long trades |
| Bull TP | Take profit level for long trades |
| Bull Entry | Entry price for long trades |
| Bear SL | Stop loss level for short trades |
| Bear TP | Take profit level for short trades |
| Bear Entry | Entry price for short trades |
### How to Use in Strategy
These values can be accessed by Pine Script strategies using:
```pine
indicator_values = request.security(syminfo.tickerid, timeframe.period,
)
```
---
## 🎓 Understanding the Filters
### Why Use Multiple Filters?
Single-indicator systems often generate too many false signals. This indicator uses a **confluence approach**:
1. **Pinbar Pattern** = Price rejection detected
2. **+ SWING Filter** = Rejection at key level
3. **+ ATR Filter** = Significant move
4. **+ RSI Filter** = Favorable momentum
**Result**: Higher probability setups with better risk:reward
### Filter Optimization
**Conservative Settings** (Fewer, Higher Quality Signals):
- ATR Filter: ON
- Swing Candles: 5
- RSI Filter: ON
- Shadow %: 75%
**Aggressive Settings** (More Signals, More Noise):
- ATR Filter: OFF
- Swing Candles: 2
- RSI Filter: OFF
- Shadow %: 65%
**Balanced Settings** (Recommended):
- ATR Filter: ON
- Swing Candles: 3
- RSI Filter: OFF (or ON for trending markets)
- Shadow %: 72%
---
## 🔍 Troubleshooting
### "No Signals Appearing"
**Possible Causes:**
1. Filters are too strict
2. No pinbars forming on chart
3. Insufficient bar history
**Solutions:**
- Reduce Shadow % to 65%
- Reduce Swing Candles to 2
- Disable ATR or RSI filters temporarily
- Check that chart has enough data loaded
### "Too Many Signals"
**Solutions:**
- Enable ATR filter
- Increase Swing Candles to 4-5
- Enable RSI filter
- Increase Shadow % to 75-80%
### "Signals Appearing Late"
**This is normal behavior!** The indicator:
- Analyzes previous closed bar
- Signals appear on the bar AFTER the pinbar
- This is what prevents repainting
- Signal latency is 1 bar (by design)
---
## 📝 Technical Specifications
**Indicator Type:** Overlay (displays on price chart)
**Pine Script Version:** 5
**Max Labels:** 500
**Max Lines:** 500
**Repainting:** None (100% non-repainting)
**Data Window Values:** 8 exported values
**Alert Types:** 3 (Combined, Bullish, Bearish)
**Performance:**
- Lightweight script (fast execution)
- Works on all timeframes
- Compatible with all markets (Forex, Crypto, Stocks, Futures)
- No data snooping bias
---
## 🎯 Use Cases
### 1. **Swing Trading**
- Timeframe: Daily, 4H
- Filter Settings: All enabled
- Best for: Catching major reversals
### 2. **Day Trading**
- Timeframe: 15m, 1H
- Filter Settings: ATR + SWING only
- Best for: Intraday reversals
### 3. **Scalping**
- Timeframe: 5m, 15m
- Filter Settings: SWING only (aggressive)
- Best for: Quick reversals (requires experience)
### 4. **Position Trading**
- Timeframe: Weekly, Daily
- Filter Settings: All enabled + high RR (2:1 or 3:1)
- Best for: Long-term trend reversal catches
---
## 🏆 Advantages Over Other Pinbar Indicators
✅ **Guaranteed Non-Repainting** - Many pinbar indicators repaint; this one never does
✅ **Automatic SL/TP** - No manual calculation needed
✅ **Multi-Layer Filtering** - Reduces false signals significantly
✅ **Visual Trade Management** - Clear entry, stop, and target levels
✅ **Flexible Configuration** - Adaptable to any trading style
✅ **Alert System** - Never miss a setup
✅ **Backtesting Ready** - Reliable historical data
✅ **Professional Grade** - Suitable for live trading
---
## 📚 Educational Resources
### Recommended Reading on Pinbars
- "The Pin Bar Trading Strategy" by Nial Fuller
- "Price Action Trading" by Al Brooks
- TradingView Education: Price Action Patterns
### Practice Recommendations
1. Paper trade signals for 20+ trades before live trading
2. Backtest on different timeframes and markets
3. Keep detailed records of all trades
4. Analyze winning vs losing setups
5. Refine filter settings based on results
---
## ⚖️ Disclaimer
This indicator is a tool for technical analysis and does not guarantee profits. Trading involves substantial risk of loss. Past performance is not indicative of future results.
- Always use proper risk management
- Never risk more than you can afford to lose
- Consider your trading experience and objectives
- Seek independent financial advice if needed
---
## 📧 Version Information
**Current Version:** 1.0
**Last Updated:** 2024
**Compatibility:** TradingView Pine Script v5
**Status:** Production Ready
---
## 🔄 Future Enhancements (Potential)
Possible future additions:
- Multi-timeframe confirmation option
- Volume filter integration
- Customizable color schemes
- Win rate statistics display
- Partial profit taking levels
- Trailing stop functionality
---
## 📖 Quick Start Guide
### 5-Minute Setup
1. **Add to Chart**
- Open TradingView
- Go to Pine Editor
- Paste the code
- Click "Add to Chart"
2. **Configure Settings**
- Open indicator settings (gear icon)
- Start with default settings
- Enable "Show SL and TP Lines"
3. **Set Alert**
- Right-click indicator name
- Click "Add Alert"
- Select "Pinbar Signal (Any Direction)"
- Configure notification method
4. **Test**
- Scroll back on chart
- Verify signals make sense
- Check that signals don't repaint
5. **Trade** (After Practice!)
- Wait for alert
- Verify signal quality
- Enter, place SL/TP
- Manage trade
---
## 🎯 Final Thoughts
The **Pinbar MTF - No Repaint** indicator is designed for serious traders who value:
- **Reliability** over flashy signals
- **Quality** over quantity
- **Honesty** over false promises
This indicator will NOT:
- Make you rich overnight
- Win every trade
- Replace proper trading education
This indicator WILL:
- Identify high-probability reversal setups
- Save you analysis time
- Provide consistent, non-repainting signals
- Help you develop a systematic trading approach
**Success in trading comes from:**
1. Proper education (60%)
2. Risk management (30%)
3. Technical tools like this indicator (10%)
Use this tool as part of a complete trading plan, not as a standalone solution.

Luxy BIG beautiful Dynamic ORBThis is an advanced Opening Range Breakout (ORB) indicator that tracks price breakouts from the first 5, 15, 30, and 60 minutes of the trading session. It provides complete trade management including entry signals, stop-loss placement, take-profit targets, and position sizing calculations.
The ORB strategy is based on the concept that the opening range of a trading session often acts as support/resistance, and breakouts from this range tend to lead to significant moves.
What Makes This Different?
Most ORB indicators simply draw horizontal lines and leave you to figure out the rest. This indicator goes several steps further:
Multi-Stage Tracking
Instead of just one ORB timeframe, this tracks FOUR simultaneously (5min, 15min, 30min, 60min). Each stage builds on the previous one, giving you multiple trading opportunities throughout the session.
Active Trade Management
When a breakout occurs, the indicator automatically calculates and displays entry price, stop-loss, and multiple take-profit targets. These lines extend forward and update in real-time until the trade completes.
Cycle Detection
Unlike indicators that only show the first breakout, this tracks the complete cycle: Breakout → Retest → Re-breakout. You can see when price returns to test the ORB level after breaking out (potential re-entry).
Failed Breakout Warning
If price breaks out but quickly returns inside the range (within a few bars), the label changes to "FAILED BREAK" - warning you to exit or avoid the trade.
Position Sizing Calculator
Built-in risk management that tells you exactly how many shares to buy based on your account size and risk tolerance. No more guessing or manual calculations.
Advanced Filtering
Optional filters for volume confirmation, trend alignment, and Fair Value Gaps (FVG) to reduce false signals and improve win rate.
Core Features Explained
### 1. Multi-Stage ORB Levels
The indicator builds four separate Opening Range levels:
ORB 5 - First 5 minutes (fastest signals, most volatile)
ORB 15 - First 15 minutes (balanced, most popular)
ORB 30 - First 30 minutes (slower, more reliable)
ORB 60 - First 60 minutes (slowest, most confirmed)
Each level is drawn as a horizontal range on your chart. As time progresses, the ranges expand to include more price action. You can enable or disable any stage and assign custom colors to each.
How it works: During the opening minutes, the indicator tracks the highest high and lowest low. Once the time period completes, those levels become your ORB high and low for that stage.
### 2. Breakout Detection
When price closes outside the ORB range, a label appears:
BREAK UP (green label above price) - Price closed above ORB High
BREAK DOWN (red label below price) - Price closed below ORB Low
The label shows which ORB stage triggered (ORB5, ORB15, etc.) and the cycle number if tracking multiple breakouts.
Important: Signals appear on bar close only - no repainting. What you see is what you get.
### 3. Retest Detection
After price breaks out and moves away, if it returns to test the ORB level, a "RETEST" label appears (orange). This indicates:
The original breakout level is now acting as support/resistance
Potential re-entry opportunity if you missed the first breakout
Confirmation that the level is significant
The indicator requires price to move a minimum distance away before considering it a valid retest (configurable in settings).
### 4. Failed Breakout Detection
If price breaks out but returns inside the ORB range within a few bars (before the breakout is "committed"), the original label changes to "FAILED BREAK" in orange.
This warns you:
The breakout lacked conviction
Consider exiting if already in the trade
Wait for better setup
Committed Breakout: The indicator tracks how many bars price stays outside the range. Only after staying outside for the minimum number of bars does it become a committed breakout that can be retested.
### 5. TP/SL Lines (Trade Management)
When a breakout occurs, colored horizontal lines appear showing:
Entry Line (cyan for long, orange for short) - Your entry price (the ORB level)
Stop Loss Line (red) - Where to exit if trade goes against you
TP1, TP2, TP3 Lines (same color as entry) - Profit targets at 1R, 2R, 3R
These lines extend forward as new bars form, making it easy to track your trade. When a target is hit, the line turns green and the label shows a checkmark.
Lines freeze (stop updating) when:
Stop loss is hit
The final enabled take-profit is hit
End of trading session (optional setting)
### 6. Position Sizing Dashboard
The dashboard (bottom-left corner by default) shows real-time information:
Current ORB stage and range size
Breakout status (Inside Range / Break Up / Break Down)
Volume confirmation (if filter enabled)
Trend alignment (if filter enabled)
Entry and Stop Loss prices
All enabled Take Profit levels with percentages
Risk/Reward ratio
Position sizing: Max shares to buy and total risk amount
Position Sizing Example:
If your account is $25,000 and you risk 1% per trade ($250), and the distance from entry to stop loss is $0.50, the calculator shows you can buy 500 shares (250 / 0.50 = 500).
### 7. FVG Filter (Fair Value Gap)
Fair Value Gaps are price inefficiencies - gaps left by strong momentum where one candle's high doesn't overlap with a previous candle's low (or vice versa).
When enabled, this filter:
Detects bullish and bearish FVGs
Draws semi-transparent boxes around these gaps
Only allows breakout signals if there's an FVG near the breakout level
Why this helps: FVGs indicate institutional activity. Breakouts through FVGs tend to be stronger and more reliable.
Proximity setting: Controls how close the FVG must be to the ORB level. 2.0x means the breakout can be within 2 times the FVG size - a reasonable default.
### 8. Volume & Trend Filters
Volume Filter:
Requires current volume to be above average (customizable multiplier). High volume breakouts are more likely to sustain.
Set minimum multiplier (e.g., 1.5x = 50% above average)
Set "strong volume" multiplier (e.g., 2.5x) that bypasses other filters
Dashboard shows current volume ratio
Trend Filter:
Only shows breakouts aligned with a higher timeframe trend. Choose from:
VWAP - Price above/below volume-weighted average
EMA - Price above/below exponential moving average
SuperTrend - ATR-based trend indicator
Combined modes (VWAP+EMA, VWAP+SuperTrend) for stricter filtering
### 9. Pullback Filter (Advanced)
Purpose:
Waits for price to pull back slightly after initial breakout before confirming the signal.
This reduces false breakouts from immediate reversals.
How it works:
- After breakout is detected, indicator waits for a small pullback (default 2%)
- Once pullback occurs AND price breaks out again, signal is confirmed
- If no pullback within timeout period (5 bars), signal is issued anyway
Settings:
Enable Pullback Filter: Turn this filter on/off
Pullback %: How much price must pull back (2% is balanced)
Timeout (bars): Max bars to wait for pullback (5 is standard)
When to use:
- Choppy markets with many fake breakouts
- When you want higher quality signals
- Combine with Volume filter for maximum confirmation
Trade-off:
- Better signal quality
- May miss some valid fast moves
- Slight entry delay
How to Use This Indicator
### For Beginners - Simple Setup
Add the indicator to your chart (5-minute or 15-minute timeframe recommended)
Leave all default settings - they work well for most stocks
Watch for BREAK UP or BREAK DOWN labels to appear
Check the dashboard for entry, stop loss, and targets
Use the position sizing to determine how many shares to buy
Basic Trading Plan:
Wait for a clear breakout label
Enter at the ORB level (or next candle open if you're late)
Place stop loss where the red line indicates
Take profit at TP1 (50% of position) and TP2 (remaining 50%)
### For Advanced Traders - Customized Setup
Choose which ORB stages to track (you might only want ORB15 and ORB30)
Enable filters: Volume (stocks) or Trend (trending markets)
Enable FVG filter for institutional confirmation
Set "Track Cycles" mode to catch retests and re-breakouts
Customize stop loss method (ATR for volatile stocks, ORB% for stable ones)
Adjust risk per trade and account size for accurate position sizing
Advanced Strategy Example:
Enable ORB15 only (disable others for cleaner chart)
Turn on Volume filter at 1.5x with Strong at 2.5x
Enable Trend filter using VWAP
Set Signal Mode to "Track Cycles" with Max 3 cycles
Wait for aligned breakouts (Volume + Trend + Direction)
Enter on retest if you missed the initial break
### Timeframe Recommendations
5-minute chart: Scalping, very active trading, crypto
15-minute chart: Day trading, balanced approach (most popular)
30-minute chart: Swing entries, less screen time
60-minute chart: Position trading, longer holds
The indicator works on any intraday timeframe, but ORB is fundamentally a day trading strategy. Daily charts don't make sense for ORB.
DEFAULT CONFIGURATION
ON by Default:
• All 4 ORB stages (5/15/30/60)
• Breakout Detection
• Retest Labels
• All TP levels (1/1.5/2/3)
• TP/SL Lines (Detailed mode)
• Dashboard (Bottom Left, Dark theme)
• Position Size Calculator
OFF by Default (Optional Filters):
• FVG Filter
• Pullback Filter
• Volume Filter
• Trend Filter
• HTF Bias Check
• Alerts
Recommended for Beginners:
• Leave all defaults
• Session Mode: Auto-Detect
• Signal Mode: Track Cycles
• Stop Method: ATR
• Add Volume Filter if trading stocks
Recommended for Advanced:
• Enable ORB15 + ORB30 only (disable 5 & 60)
• Enable: Volume + Trend + FVG
• Signal Mode: Track Cycles, Max 3
• Stop Method: ATR or Safer
• Enable HTF Daily bias check
## Settings Guide
The settings are organized into logical groups. Here's what each section controls:
### ORB COLORS Section
Show Edge Labels: Display "ORB 5", "ORB 15" labels at the right edge of the levels
Background: Fill the area between ORB high/low with color
Transparency: How see-through the background is (95% is nearly invisible)
Enable ORB 5/15/30/60: Turn each stage on or off individually
Colors: Assign colors to each ORB stage for easy identification
### SESSION SETTINGS Section
Session Mode: Choose trading session (Auto-Detect works for most instruments)
Custom Session Hours: Define your own hours if needed (format: HHMM-HHMM)
Auto-Detect uses the instrument's natural hours (stocks use exchange hours, crypto uses 24/7).
### BREAKOUT DETECTION Section
Enable Breakout Detection: Master switch for signals
Show Retest Labels: Display retest signals
Label Size: Visual size for all labels (Small recommended)
Enable FVG Filter: Require Fair Value Gap confirmation
Show FVG Boxes: Display the gap boxes on chart
Signal Mode: "First Only" = one signal per direction per day, "Track Cycles" = multiple signals
Max Cycles: How many breakout-retest cycles to track (6 is balanced)
Breakout Buffer: Extra distance required beyond ORB level (0.1-0.2% recommended)
Min Distance for Retest: How far price must move away before retest is valid (2% recommended)
Min Bars Outside ORB: Bars price must stay outside for committed breakout (2 is balanced)
### TARGETS & RISK Section
Enable Targets & Stop-Loss: Calculate and show trade management
TP1/TP2/TP3 checkboxes: Select which profit targets to display
Stop Method: How to calculate stop loss placement
- ATR: Based on volatility (best for most cases)
- ORB %: Fixed % of ORB range
- Swing: Recent swing high/low
- Safer: Widest of all methods
ATR Length & Multiplier: Controls ATR stop distance (14 period, 1.5x is standard)
ORB Stop %: Percentage beyond ORB for stop (20% is balanced)
Swing Bars: Lookback period for swing high/low (3 is recent)
### TP/SL LINES Section
Show TP/SL Lines: Display horizontal lines on chart
Label Format: "Short" = minimal text, "Detailed" = shows prices
Freeze Lines at EOD: Stop extending lines at session close
### DASHBOARD Section
Show Info Panel: Display the metrics dashboard
Theme: Dark or Light colors
Position: Where to place dashboard on chart
Toggle rows: Show/hide specific information rows
Calculate Position Size: Enable the position sizing calculator
Risk Mode: Risk fixed $ amount or % of account
Account Size: Your total trading capital
Risk %: Percentage to risk per trade (0.5-1% recommended)
### VOLUME FILTER Section
Enable Volume Filter: Require volume confirmation
MA Length: Average period (20 is standard)
Min Volume: Required multiplier (1.5x = 50% above average)
Strong Volume: Multiplier that bypasses other filters (2.5x)
### TREND FILTER Section
Enable Trend Filter: Require trend alignment
Trend Mode: Method to determine trend (VWAP is simple and effective)
Custom EMA Length: If using EMA mode (50 for swing, 20 for day trading)
SuperTrend settings: Period and Multiplier if using SuperTrend mode
### HIGHER TIMEFRAME Section
Check Daily Trend: Display higher timeframe bias in dashboard
Timeframe: What TF to check (D = daily, recommended)
Method: Price vs MA (stable) or Candle Direction (reactive)
MA Period: EMA length for Price vs MA method (20 is balanced)
Min Strength %: Minimum strength threshold for HTF bias to be considered
- For "Price vs MA": Minimum distance (%) from moving average
- For "Candle Direction": Minimum candle body size (%)
- 0.5% is balanced - increase for stricter filtering
- Lower values = more signals, higher values = only strong trends
### ALERTS Section
Enable Alerts: Master switch (must be ON to use any alerts)
Breakout Alerts: Notify on ORB breakouts
Retest Alerts: Notify when price retests after breakout
Failed Break Alerts: Notify on failed breakouts
Stage Complete Alerts: Notify when each ORB stage finishes forming
After enabling desired alert types, click "Create Alert" button, select this indicator, choose "Any alert() function call".
## Tips & Best Practices
### General Trading Tips
ORB works best on liquid instruments (stocks with good volume, major crypto pairs)
First hour of the session is most important - that's when ORB is forming
Breakouts WITH the trend have higher success rates - use the trend filter
Failed breakouts are common - use the "Min Bars Outside" setting to filter weak moves
Not every day produces good ORB setups - be patient and selective
### Position Sizing Best Practices
Never risk more than 1-2% of your account on a single trade
Use the built-in calculator - don't guess your position size
Update your account size monthly as it grows
Smaller accounts: use $ Amount mode for simplicity
Larger accounts: use % of Account mode for scaling
### Take Profit Strategy
Most traders use: 50% at TP1, 50% at TP2
Aggressive: Hold through TP1 for TP2 or TP3
Conservative: Full exit at TP1 (1:1 risk/reward)
After TP1 hits, consider moving stop to breakeven
TP3 rarely hits - only on strong trending days
### Filter Combinations
Maximum Quality: Volume + Trend + FVG (fewest signals, highest quality)
Balanced: Volume + Trend (good quality, reasonable frequency)
Active Trading: No filters or Volume only (many signals, lower quality)
Trending Markets: Trend filter essential (indices, crypto)
Range-Bound: Volume + FVG (avoid trend filter)
### Common Mistakes to Avoid
Chasing breakouts - wait for the bar to close, don't FOMO into wicks
Ignoring the stop loss - always use it, move it manually if needed
Over-leveraging - the calculator shows MAX shares, you can buy less
Trading every signal - quality > quantity, use filters
Not tracking results - keep a journal to see what works for YOU
## Pros and Cons
### Advantages
Complete all-in-one solution - from signal to position sizing
Multiple timeframes tracked simultaneously
Visual clarity - easy to see what's happening
Cycle tracking catches opportunities others miss
Built-in risk management eliminates guesswork
Customizable filters for different trading styles
No repainting - what you see is locked in
Works across multiple markets (stocks, forex, crypto)
### Limitations
Intraday strategy only - doesn't work on daily charts
Requires active monitoring during first 1-2 hours of session
Not suitable for after-hours or extended sessions by default
Can produce many signals in choppy markets (use filters)
Dashboard can be overwhelming for complete beginners
Performance depends on market conditions (trends vs ranges)
Requires understanding of risk management concepts
### Best For
Day traders who can watch the first 1-2 hours of market open
Traders who want systematic entry/exit rules
Those learning proper position sizing and risk management
Active traders comfortable with multiple signals per day
Anyone trading liquid instruments with clear sessions
### Not Ideal For
Swing traders holding multi-day positions
Set-and-forget / passive investors
Traders who can't watch market open
Complete beginners unfamiliar with trading concepts
Low volume / illiquid instruments
## Frequently Asked Questions
Q: Why are no signals appearing?
A: Check that you're on an intraday timeframe (5min, 15min, etc.) and that the current time is within your session hours. Also verify that "Enable Breakout Detection" is ON and at least one ORB stage is enabled. If using filters, they might be blocking signals - try disabling them temporarily.
Q: What's the best ORB stage to use?
A: ORB15 (15 minutes) is most popular and balanced. ORB5 gives faster signals but more noise. ORB30 and ORB60 are slower but more reliable. Many traders use ORB15 + ORB30 together.
Q: Should I enable all the filters?
A: Start with no filters to see all signals. If too many false signals, add Volume filter first (stocks) or Trend filter (trending markets). FVG filter is most restrictive - use for maximum quality but fewer signals.
Q: How do I know which stop loss method to use?
A: ATR works for most cases - it adapts to volatility. Use ORB% if you want predictable stop placement. Swing is for respecting chart structure. Safer gives you the most room but largest risk.
Q: Can I use this for swing trading?
A: Not really - ORB is fundamentally an intraday strategy. The ranges reset each day. For swing trading, look at weekly support/resistance or moving averages instead.
Q: Why do TP/SL lines disappear sometimes?
A: Lines freeze (stop extending) when: stop loss is hit, the last enabled take-profit is hit, or end of session arrives (if "Freeze at EOD" is enabled). This is intentional - the trade is complete.
Q: What's the difference between "First Only" and "Track Cycles"?
A: "First Only" shows one breakout UP and one DOWN per day maximum - clean but might miss opportunities. "Track Cycles" shows breakout-retest-rebreak sequences - more signals but busier chart.
Q: Is position sizing accurate for options/forex?
A: The calculator is designed for shares (stocks). For options, ignore the share count and use the risk amount. For forex, you'll need to adapt the lot size calculation manually.
Q: How much capital do I need to use this?
A: The indicator works for any account size, but practical day trading typically requires $25,000 in the US due to Pattern Day Trader rules. Adjust the "Account Size" setting to match your capital.
Q: Can I backtest this strategy?
A: This is an indicator, not a strategy script, so it doesn't have built-in backtesting. You can visually review historical signals or code a strategy script using similar logic.
Q: Why does the dashboard show different entry price than the breakout label?
A: If you're looking at an old breakout, the ORB levels may have changed when the next stage completed. The dashboard always shows the CURRENT active range and trade setup.
Q: What's a good win rate to expect?
A: ORB strategies typically see 40-60% win rate depending on market conditions and filters used. The strategy relies on positive risk/reward ratios (2:1 or better) to be profitable even with moderate win rates.
Q: Does this work on crypto?
A: Yes, but crypto trades 24/7 so you need to define what "session start" means. Use Session Mode = Custom and set your preferred daily reset time (e.g., 0000-2359 UTC).
## Credits & Transparency
### Development
This indicator was developed with the assistance of AI technology to implement complex ORB trading logic.
The strategy concept, feature specifications, and trading logic were designed by the publisher. The implementation leverages modern development tools to ensure:
Clean, efficient, and maintainable code
Comprehensive error handling and input validation
Detailed documentation and user guidance
Performance optimization
### Trading Concepts
This indicator implements several public domain trading concepts:
Opening Range Breakout (ORB): Trading strategy popularized by Toby Crabel, Mark Fisher and many more talanted traders.
Fair Value Gap (FVG): Price imbalance concept from ICT methodology
SuperTrend: ATR-based trend indicator using public formula
Risk/Reward Ratio: Standard risk management principle
All mathematical formulas and technical concepts used are in the public domain.
### Pine Script
Uses standard TradingView built-in functions:
ta.ema(), ta.atr(), ta.vwap(), ta.highest(), ta.lowest(), request.security()
No external libraries or proprietary code from other authors.
## Disclaimer
This indicator is provided for educational and informational purposes only. It is not financial advice.
Trading involves substantial risk of loss and is not suitable for every investor. Past performance shown in examples is not indicative of future results.
The indicator provides signals and calculations, but trading decisions are solely your responsibility. Always:
Test strategies on paper before using real money
Never risk more than you can afford to lose
Understand that all trading involves risk
Consider seeking advice from a licensed financial advisor
The publisher makes no guarantees regarding accuracy, profitability, or performance. Use at your own risk.
---
Version: 3.0
Pine Script Version: v6
Last Updated: October 2024
For support, questions, or suggestions, please comment below or send a private message.
---
Happy trading, and remember: consistent risk management beats perfect entry timing every time.

Synapse Dynamics - Market Structure📊 SYNAPSE DYNAMICS - MARKET STRUCTURE INDICATOR
An educational tool for learning and practicing Smart Money Concepts (SMC) methodology through visual representation of institutional price action patterns.
═══════════════════════════════════════════════════
🎯 WHAT THIS INDICATOR DISPLAYS
This indicator visualizes Smart Money Concepts patterns on your chart:
- Order Blocks (OB) - Supply and demand zones based on institutional order flow theory. The indicator identifies these areas using price action criteria including the final opposing candle before a strong directional move.
- Breaker Blocks - Failed order blocks that may act as support/resistance. These occur when an order block is invalidated but price returns to the zone, potentially reversing its role.
- Fair Value Gaps (FVG) - Three-candle imbalance patterns where price gaps create inefficiencies. The indicator marks these zones for reference in analysis.
- Market Structure - Break of Structure (BOS) and Change of Character (CHoCH) patterns based on swing high/low breaks. These help identify potential trend continuation or reversal points.
- Reference Entry Signals - The indicator calculates potential entry zones with accompanying stop loss and take profit reference levels based on order block and FVG locations. These are for educational reference only.
- Higher Timeframe Context - Optional filter that displays the higher timeframe trend direction to provide additional market context.
- Information Panel - On-screen dashboard showing active reference signals, their status, and relevant price levels.
- Swing Point Mapping - Labels recent higher highs (HH), higher lows (HL), lower highs (LH), and lower lows (LL) based on configurable swing detection parameters.
═══════════════════════════════════════════════════
⚙️ HOW IT WORKS
The indicator uses the following methodology:
**Order Block Detection:** Identifies the last opposing candle before a strong directional move that breaks structure. Filters blocks by size to reduce noise.
**Market Structure Analysis:** Tracks swing points and identifies when price breaks previous highs/lows to determine BOS or CHoCH patterns.
**Fair Value Gap Identification:** Detects three-candle patterns where candle 1's high/low doesn't overlap with candle 3's low/high, creating an imbalance zone.
**Reference Signal Generation:** Combines order block proximity, FVG presence, and market structure breaks to suggest potential study areas. Optional HTF trend filter can be enabled.
**Timeframe Adaptation:** Automatically adjusts swing detection sensitivity based on the chart timeframe (using multipliers for intraday vs. higher timeframes).
═══════════════════════════════════════════════════
📚 EDUCATIONAL PURPOSE & IMPORTANT LIMITATIONS
**This indicator is designed as an educational tool for:**
- Learning Smart Money Concepts methodology
- Practicing pattern recognition
- Understanding institutional price action theories
- Analyzing market structure visually
**Critical Understanding:**
- All signals and levels are REFERENCE POINTS for study - not trading recommendations
- The indicator displays patterns based on historical price action - it cannot predict future movements
- Smart Money Concepts is a theoretical framework - market behavior varies
- Backtested or historical results shown do not guarantee future performance
- No indicator can account for all market variables, news events, or changing conditions
**Proper Use:**
This tool is meant to assist in learning technical analysis concepts. Users must develop their own analysis skills, risk management strategies, and trading plans. The displayed patterns require interpretation within broader market context.
═══════════════════════════════════════════════════
⚙️ CUSTOMIZATION OPTIONS
**Adjustable Parameters:**
- Order Block: Minimum size threshold, maximum count displayed
- Fair Value Gaps: Toggle visibility, maximum count
- Market Structure: Swing detection length, BOS/CHoCH display
- Signals: Entry/SL/TP calculation method, HTF filter toggle
- Visual Settings: Colors, line styles, label sizes, panel position
**Timeframe Compatibility:**
Works on all timeframes from 1-minute to monthly charts. The swing detection automatically scales based on timeframe.
═══════════════════════════════════════════════════
⚠️ DISCLAIMER
This indicator is for educational and informational purposes only. It does not constitute financial advice or trading recommendations. Trading involves substantial risk of loss. Past patterns and historical analysis do not indicate future results. Users are responsible for their own trading decisions and risk management. The author assumes no liability for trading losses.
═══════════════════════════════════════════════════
🔧 ALERT FUNCTIONALITY
Built-in alert conditions notify you when:
- New order blocks are detected
- Market structure changes occur (BOS/CHoCH)
- Reference entry signals appear
Configure alerts through TradingView's alert system.

PRO Scalper(EN)
## What it is
**PRO Scalper** is an intraday price–action and liquidity map that helps you see where the market is likely to move **now**, not just where it has been.
It combines five building blocks that professional scalpers often watch together:
1. **Session Volume-Weighted Average Price (VWAP)** — the intraday “fair value” anchor.
2. **Opening Range** — the first minutes of the session that set the day’s balance.
3. **Trend filter** — higher-timeframe bias using **Exponential Moving Averages (EMA)** and optional **Average Directional Index (ADX)** strength.
4. **Two independent Supply/Demand zone engines** — zones are drawn from confirmed swing pivots, with midlines and **touch counters**.
5. **Order-flow style visuals**:
* **Delta bubbles** (green/red circles) show where buying or selling pressure was unusually strong, using a safe **delta proxy** (no external feeds).
* **Liquidity densities** (subtle rectangular bands) highlight clusters of large activity that often act as magnets or barriers and disappear when “eaten” by strong moves.
This mix gives you a **complete intraday picture**: the mean (VWAP), the day’s initial balance (Opening Range), the higher-timeframe push (trend filter), the nearby fuel or brakes (zones), and the live pressure points (bubbles and densities).
---
## Why these components
* **VWAP** tracks where the bulk of traded value sits. Price tends to rotate around it or accelerate away from it — a perfect compass for scalps.
* **Opening Range** frames the early auction. Many intraday breaks, fades and retests start at its boundaries.
* **EMA bias + ADX strength** separates trending conditions from chop, so you can keep only the zones that agree with the bigger push.
* **Pivot-based zones (two pairs at once)** are simple, objective and fast. Midlines help with confirmations; touch counters quantify how many times the zone was tested.
* **Bubbles and densities** add the “effort” layer: where the push appeared and where liquidity is concentrated. You see **where** a move is likely to continue or fail.
Together they reduce ambiguity: **context + level + effort** — all on one screen.
---
## How it works (plain language)
* **VWAP** resets each day and is calculated as the cumulative sum of typical price multiplied by volume divided by total volume.
* **Opening Range** is either automatic (a multiple of your chart timeframe) or a manual number of minutes. While it is forming, the highest high and lowest low are captured and plotted as the range.
* **Trend filter**
* **EMA Fast** and **EMA Slow** define directional bias.
* **ADX (optional)** adds “trend strength”: only when the Average Directional Index is above the chosen threshold do we treat the move as strong. You can source this from a higher timeframe.
* **Zones**
* There are **two independent pairs** of pivots at the same time (for example 10-left 10-right and 5-left 5-right).
* Each detected pivot creates a **Supply** (from a swing high) or **Demand** (from a swing low) box. Box depth = **zone depth × Average True Range** for adaptive sizing; the boxes **extend forward**.
* Midline (optional dashed line inside the box) is the “balance” of the zone.
* **“Only in trend”** mode can hide boxes that go against the higher-timeframe bias.
* The **touch counter** increases when price revisits the box. Labels show the pair name and the number of touches.
* **Bubbles**
* A safe **delta proxy** measures bar pressure (for example, range-weighted close vs open).
* A **quantile filter** shows only unusually large pressure: choose lookback and percentile, and the script draws a circle sized by intensity (green = bullish pressure, red = bearish).
* **Densities**
* The script marks heavy activity clusters as **subtle bands** around price (depth = fraction of Average True Range).
* If price **breaks** a density with volume above its moving average, the band **disappears** (“eaten”), which often precedes continuation.
---
## How to use — practical playbooks
> Recommended chart: crypto or index futures, one to five minutes. Use **one hour** or **fifteen minutes** for the higher-timeframe bias.
### 1) Trend pullback scalp (continuation)
1. Enable **Only in trend** zones.
2. In an uptrend: wait for a pullback into a **Demand** zone that overlaps with VWAP or sits just below the Opening Range midpoint.
3. Look for **green bubbles** near the zone’s bottom or a fresh **density** under price.
4. Enter on a candle closing **back above the zone midline**.
5. Stop-loss: below the bottom of the zone or a small multiple of Average True Range.
6. Targets: previous swing high, Opening Range high, fixed risk multiples, or VWAP.
Mirror the logic for downtrends using Supply zones, red bubbles and densities above price.
### 2) Reversion with liquidity sweep (fade)
1. Bias neutral or countertrend allowed.
2. Price **wicks through** a zone boundary (or an Opening Range line) and **closes back inside** the zone.
3. The bubble color often flips (absorption).
4. Enter toward the **inside** of the zone; stop beyond the sweep wick; first target = zone midline, second = opposite side of the zone or VWAP.
### 3) Opening Range break and retest
1. Wait for the Opening Range to complete.
2. A break with a large bubble suggests intent.
3. Look for a **retest** into a nearby zone aligned with VWAP.
4. Trade continuation toward the next zone or the session extremes.
### 4) Density “eaten” continuation
1. When a density band **disappears** on high volume, it often means the resting liquidity was consumed.
2. Trade in the direction of the break, toward the nearest opposing zone.
---
## Settings — quick guide
**Core**
* *ATR Length* — used for zone and density depths.
* *Show VWAP / Show Opening Range*.
* *Opening Range*: Auto (multiple of timeframe minutes) or Manual minutes.
**Trend Filter**
* *Mode*: Off, EMA only, or EMA with ADX strength.
* *Use higher timeframe* and its value.
* *EMA Fast / EMA Slow*, *ADX Length*, *ADX threshold*.
* *Plot EMA filter* to display the moving averages.
**Zones (two pairs)**
* *Pivot A Left / Right* and *Pivot B Left / Right*.
* *Zone depth × ATR*, *Extend bars*.
* *Show zone midline*, *Only in trend zones*.
* Labels automatically show the touch counters.
**Bubbles**
* *Show Bubbles*.
* *Quantile lookback* and *Quantile percent* (higher percent = stricter filter, fewer bubbles).
**Densities**
* *Metric*: absolute delta proxy or raw volume.
* *Quantile lookback / percent*.
* *Depth × ATR*, *Extend bars*, *Merge distance* (in ATR),
* *Break condition*: volume moving average length and multiplier,
* *Midline for densities* (optional dashed line).
---
## Tips and risk management
* This script **does not use external order-flow feeds**. Delta is a **proxy** suitable for TradingView; tune quantiles per symbol and timeframe.
* Do not trade every bubble. Combine **context (trend + VWAP + Opening Range)** with **level (zone)** and **effort (bubble/density)**.
* Set stop-losses beyond the zone or at a fraction of Average True Range. Predefine risk per trade.
* Backtest your rules with a strategy script before using real funds.
* Markets differ. Parameters that work on Bitcoin may not transfer to low-liquidity altcoins or stocks.
* Nothing here is financial advice. Scalping is high-risk; slippage and over-trading can quickly damage your account.
---
## What makes PRO Scalper unique
* Two **independent** zone engines run in parallel, so you can see both **larger structure** and **fine intraday levels** at the same time.
* Clean **“only in trend” rendering** — zones and midlines against the bias can be hidden, reducing clutter and hesitation.
* **Touch counters** convert “feel” into numbers.
* **Self-contained order-flow visuals** (bubbles and densities) that require no extra data sources.
* Careful defaults: subtle colors for densities, clearer zones, and responsive auto Opening Range.
---
(RU)
## Что это такое
**PRO Scalper** — это индикатор для внутридневной торговли, который показывает **контекст и ликвидность прямо сейчас**.
Он объединяет пять модулей, которыми профессиональные скальперы пользуются вместе:
1. **VWAP** — средневзвешенная по объему цена за сессию, «справедливая стоимость» дня.
2. **Opening Range** — первая часть сессии, задающая баланс дня.
3. **Фильтр тренда** — направление старшего таймфрейма по **экспоненциальным средним** и при желании по силе тренда **Average Directional Index**.
4. **Две независимые системы зон спроса/предложения** — зоны строятся от подтвержденных экстремумов (пивотов), имеют **среднюю линию** и **счетчик касаний**.
5. **Визуализация «ордер-флоу»**:
* **Пузыри дельты** (зеленые/красные круги) — места повышенного покупательного/продажного давления, рассчитанные через безопасный **прокси-дельты**.
* **Плотности ликвидности** (ненавязчивые прямоугольные ленты) — скопления объема, которые нередко притягивают цену или удерживают ее и исчезают, когда «разъедаются» сильным движением.
Итог — **полная картинка момента**: среднее (VWAP), баланс дня (Opening Range), старшая сила (фильтр тренда), ближайшие уровни топлива/тормозов (зоны), текущие точки усилия (пузыри и плотности).
---
## Почему именно эти элементы
* **VWAP** показывает, где сосредоточена стоимость; цена либо вращается вокруг него, либо быстро уходит — идеальный ориентир скальпера.
* **Opening Range** фиксирует ранний аукцион — от его границ часто начинаются пробои, возвраты и ретесты.
* **EMA + ADX** отделяют тренд от «пилы», позволяя оставлять на графике только зоны по направлению старшего таймфрейма.
* **Зоны от пивотов** просты, объективны и быстры; средняя линия помогает подтверждать разворот, счетчик касаний переводит субъективность в цифры.
* **Пузыри и плотности** добавляют слой «усилия»: где именно возник толчок и где сконцентрирована ликвидность.
Комбинация **контекста + уровня + усилия** уменьшает двусмысленность и ускоряет принятие решения.
---
## Как это работает (простыми словами)
* **VWAP** каждый день стартует заново: сумма «типичной цены × объем» делится на суммарный объем.
* **Opening Range** — автоматический (кратный минутам вашего таймфрейма) или вручную заданный период; пока он формируется, фиксируются максимум и минимум.
* **Фильтр тренда**
* Две экспоненциальные средние задают направление.
* **ADX** (по желанию) добавляет «силу». Источник можно взять со старшего таймфрейма.
* **Зоны**
* Одновременно работает **две пары** пивотов (например 10-лево 10-право и 5-лево 5-право).
* От пивота строится зона **предложения** (от максимума) или **спроса** (от минимума). Глубина зоны = **коэффициент × Average True Range**; зона тянется вперед.
* Внутри рисуется **средняя линия** (по желанию).
* Режим **«только по тренду»** скрывает зоны против старшего направления.
* **Счетчик касаний** увеличивается, когда цена снова входит в зону; подпись показывает пару и количество касаний.
* **Пузыри**
* Используется безопасный **прокси-дельты** — измерение «напряжения» внутри свечи.
* Через **квантильный фильтр** выводятся только необычно сильные места: настраиваются окно и процент квантиля; размер кружка — сила, цвет: зеленый покупатели, красный продавцы.
* **Плотности**
* Крупные активности отмечаются **ненавязчивыми прямоугольниками** (глубина — доля Average True Range).
* Если плотность **пробивается** объемом выше среднего, она **исчезает** — часто это предвещает продолжение.
---
## Как пользоваться — практические схемы
> Рекомендация: крипто или фьючерсы, таймфрейм 1–5 минут. Для старшего фильтра удобно взять **1 час** или **15 минут**.
### 1) Скальп на откат по тренду
1. Включите **«только по тренду»**.
2. В восходящем тренде дождитесь отката в **зону спроса**, желательно рядом с **VWAP** или серединой **Opening Range**.
3. Подтверждение — **зеленые пузыри** у нижней границы зоны или свежая **плотность** под ценой.
4. Вход после закрытия свечи **выше средней линии** зоны.
5. Стоп-лосс: за нижнюю границу зоны или небольшой множитель Average True Range.
6. Цели: предыдущий максимум, верх Opening Range, фиксированные R-множители, либо VWAP.
Для нисходящего тренда зеркально: зоны предложения, красные пузыри и плотности над ценой.
### 2) Контрдвижение с «выбиванием ликвидности»
1. Нейтральный или контртрендовый режим.
2. Цена **выносит хвостом** границу зоны (или линию Opening Range) и **закрывается обратно внутри**.
3. Цвет пузыря часто меняется (поглощение).
4. Вход внутрь зоны; стоп — за хвост выбивания; цели: средняя линия, противоположная граница зоны или VWAP.
### 3) Пробой Opening Range + ретест
1. Дождитесь завершения диапазона.
2. Сильный пробой с крупным пузырем — признак намерения.
3. Ищите **ретест** в зоне по тренду рядом с линией диапазона и VWAP.
4. Торгуйте продолжение к следующей зоне.
### 4) Продолжение после «съеденной» плотности
1. Когда прямоугольник плотности **исчезает** на повышенном объеме, это значит, что ликвидность поглощена.
2. Торгуйте в сторону пробоя к ближайшей противоположной зоне.
---
## Настройки — краткая шпаргалка
**Core**
— Длина Average True Range (для размеров зон и плотностей).
— Включение VWAP и Opening Range.
— Длина Opening Range: автоматическая (кратная минутам ТФ) или ручная.
**Trend Filter**
— Режим: выкл., только средние, либо средние + ADX.
— Источник со старшего таймфрейма и его значение.
— Длины средних, длина ADX и порог силы.
— Показать/скрыть линий средних.
**Zones (две пары одновременно)**
— Пара A: лев/прав; Пара B: лев/прав.
— Глубина зоны × Average True Range, продление по барам.
— Средняя линия, режим **«только по тренду»**.
— Подписи со счетчиком касаний.
**Bubbles**
— Вкл./выкл., окно поиска и процент квантиля (чем выше процент — тем реже пузыри).
**Densities**
— Метрика: абсолютная прокси-дельты или чистый объем.
— Окно/квантиль, глубина × Average True Range, продление,
— Порог объединения (в Average True Range),
— Условие «разъедания» по объему,
— Средняя линия плотности (по желанию).
---
## Советы и риски
* Индикатор **не использует внешние потоки ордер-флоу**. Дельта — **прокси**, подходящая для TradingView; подбирайте квантили под инструмент и таймфрейм.
* Не торгуйте каждый пузырь. Склейте **контекст (тренд + VWAP + Opening Range)** с **уровнем (зона)** и **усилием (пузырь/плотность)**.
* Стоп-лосс — за границей зоны или по Average True Range. Риск на сделку задавайте заранее.
* Перед реальными деньгами протестируйте правила в стратегии.
* Разные рынки ведут себя по-разному; настройки из Биткоина могут не подойти малоликвидным альткоинам или акциям.
* Это не инвестиционная рекомендация. Скальпинг — высокий риск; проскальзывание и переизбыток сделок быстро наносят ущерб капиталу.
---
## Чем уникален PRO Scalper
* Две **одновременные** системы зон показывают и **крупную структуру**, и **точные локальные уровни**.
* Режим **«только по тренду»** чистит экран от лишних уровней и ускоряет решение.
* **Счетчики касаний** дают количественную опору.
* **Самодостаточные визуализации усилия** (пузыри и плотности) — без сторонних источников данных.
* Аккуратная цветовая схема: плотности — мягко, зоны — ясно; Opening Range — адаптивный.
Пусть он станет вашей «картой местности» для быстрых и дисциплинированных решений внутри дня.

FVG Buy/Sell [Multi-TF] by akshaykiriti1443The FVG Buy/Sell indicator is a precision trading tool designed for traders who operate with a clear directional bias. It excels at identifying high-probability entry points by detecting when price interacts with Fair Value Gaps (FVGs).
This indicator is built on a core principle: instead of predicting the market's direction, it provides the timing for an entry after you, the trader, have established your market bias. By automatically pinpointing bullish and bearish imbalances on both the current and a higher timeframe, it allows you to wait for the market to pull back to a key level and then provides a clear signal for execution.
The Core Strategy: Bias First, Entry Second
This indicator is most powerful when used as part of a two-step trading process. It is not a standalone signal generator; it is an entry confirmation tool.
Step 1: Determine Your Directional Bias
Before looking for any signals from this indicator, you must first have an opinion on the market's most likely direction. This bias should be derived from your primary analysis method, such as:
The Golden Rule:
If your bias is BULLISH, you will ONLY look for BUY signals generated by bullish (green/blue) FVGs. You will ignore all SELL signals.
If your bias is BEARISH, you will ONLY look for SELL signals generated by bearish (pink/orange) FVGs. You will ignore all BUY signals.
Step 2: Execute with the FVG Tap-In Signal
Once your bias is set, the indicator does the rest of the work. You simply wait for the price to pull back into an FVG zone that aligns with your bias and then wait for the confirmation arrow to appear.
A green up arrow confirms that price has tapped a bullish FVG and closed above it, signaling that support has held and it's a valid moment to enter a long position.
A red down arrow confirms that price has tapped a bearish FVG and closed below it, signaling that resistance has held and it's a valid moment to enter a short position.
How to Take a Trade (Step-by-Step Examples)
Example of a Bullish (Long) Trade Setup:
Establish Bias: Your primary analysis shows the market is in a clear uptrend. Your bias is Bullish. You are now only looking for buying opportunities.
Identify Zone: The indicator draws a bullish FVG (a green or blue box) during an impulsive up-move.
Wait for Pullback: Be patient and let the price retrace down into this FVG zone. Do not chase the price.
Confirmation Signal: A green UP arrow appears below a candle. This is your signal. It confirms that buyers have stepped in at the FVG level and defended it.
Entry: Enter a long (buy) position at the open of the candle immediately following the signal candle.
Stop Loss: Place your stop loss below the low of the signal candle or, for a safer stop, below the bottom of the FVG zone itself.
Take Profit: Target a previous high, a higher-timeframe resistance level, or use a risk-to-reward ratio like 1:2 or 1:3.
Example of a Bearish (Short) Trade Setup:
Establish Bias: Your primary analysis shows the market is breaking down into a downtrend. Your bias is Bearish. You are now only looking for selling opportunities.
Identify Zone: The indicator draws a bearish FVG (a pink or orange box) during an impulsive down-move.
Wait for Pullback: Patiently wait for the price to rally back up into this FVG zone.
Confirmation Signal: A red DOWN arrow appears above a candle. This is your confirmation that sellers have rejected the price at this level.
Entry: Enter a short (sell) position at the open of the next candle.
Stop Loss: Place your stop loss above the high of the signal candle or above the top of the FVG zone.
Take Profit: Target a previous low, a key support level, or the next major FVG below.
Features Explained in Detail
Multi-Timeframe (MTF) Analysis: HTF zones (dotted lines) carry more weight. A signal from a 4-hour FVG while you are on a 15-minute chart is significantly more powerful than a signal from a 15-minute FVG alone. Use HTF zones as major points of interest.
Confirmed Tap-In Logic: The arrow only appears after price has touched the zone and then closed outside of it in the expected direction. This built-in confirmation filters out wicks that simply pass through a zone without a real market reaction.
Dual Alert System:
Entry Alert ("Price has entered..."): This is a heads-up alert. It tells you to pay attention because price is now in your pre-defined zone of interest.
Tap-In Alert ("Confirmed tap-in..."): This is the execution alert. It signals that the conditions for a trade have been met according to the indicator's logic.
Fade on Tapped: When enabled, a zone will become transparent after a confirmed signal. This visually cleans up your chart, showing you which zones have already been tested and "mitigated."
Minimum FVG Size (Ticks): In volatile or ranging markets, many tiny, insignificant FVGs can form. Use this setting to filter out the noise. Increase the value to only display larger, more significant imbalances.
Disclaimer: Trading involves substantial risk. This indicator is a tool for analysis and should not be used as a sole reason to enter a trade. Always practice robust risk management and use this tool in conjunction with your own trading plan. Past performance is not indicative of future results.

Opening Range IndicatorComplete Trading Guide: Opening Range Breakout Strategy
What Are Opening Ranges?
Opening ranges capture the high and low prices during the first few minutes of market open. These levels often act as key support and resistance throughout the trading day because:
Heavy volume occurs at market open as overnight orders execute
Institutional activity is concentrated during opening minutes
Price discovery happens as market participants react to overnight news
Psychological levels are established that traders watch all day
Understanding the Three Timeframes
OR5 (5-Minute Range: 9:30-9:35 AM)
Most sensitive - captures immediate market reaction
Quick signals but higher false breakout rate
Best for scalping and momentum trading
Use for early entry when conviction is high
OR15 (15-Minute Range: 9:30-9:45 AM)
Balanced approach - most popular among day traders
Moderate sensitivity with better reliability
Good for swing trades lasting several hours
Primary timeframe for most strategies
OR30 (30-Minute Range: 9:30-10:00 AM)
Most reliable but slower signals
Lower false breakout rate
Best for position trades and trend following
Use when looking for major moves
Core Trading Strategies
Strategy 1: Basic Breakout
Setup:
Wait for price to break above OR15 high or below OR15 low
Enter on the breakout candle close
Stop loss: Opposite side of the range
Target: 2-3x the range size
Example:
OR15 range: $100.00 - $102.00 (Range = $2.00)
Long entry: Break above $102.00
Stop loss: $99.50 (below OR15 low)
Target: $104.00+ (2x range size)
Strategy 2: Multiple Confirmation
Setup:
Wait for OR5 break first (early signal)
Confirm with OR15 break in same direction
Enter on OR15 confirmation
Stop: Below OR30 if available, or OR15 opposite level
Why it works:
Multiple timeframe confirmation reduces false signals and increases probability of sustained moves.
Strategy 3: Failed Breakout Reversal
Setup:
Price breaks OR15 level but fails to hold
Wait for re-entry into the range
Enter reversal trade toward opposite OR level
Stop: Recent breakout high/low
Target: Opposite side of range + extension
Key insight: Failed breakouts often lead to strong moves in the opposite direction.
Advanced Techniques
Range Quality Assessment
High-Quality Ranges (Trade these):
Range size: 0.5% - 2% of stock price
Clean boundaries (not choppy)
Volume spike during range formation
Clear rejection at range levels
Low-Quality Ranges (Avoid these):
Very narrow ranges (<0.3% of stock price)
Extremely wide ranges (>3% of stock price)
Choppy, overlapping candles
Low volume during formation
Volume Confirmation
For Breakouts:
Look for volume spike (2x+ average) on breakout
Declining volume often signals false breakout
Rising volume during range formation shows interest
Market Context Filters
Best Conditions:
Trending market days (SPY/QQQ with clear direction)
Earnings reactions or news-driven moves
High-volume stocks with good liquidity
Volatility above average (VIX considerations)
Avoid Trading When:
Extremely low volume days
Major economic announcements pending
Holidays or half-days
Choppy, sideways market conditions
Risk Management Rules
Position Sizing
Conservative: Risk 0.5% of account per trade
Moderate: Risk 1% of account per trade
Aggressive: Risk 2% maximum per trade
Stop Loss Placement
Inside the range: Quick exit but higher stop-out rate
Outside opposite level: More room but larger risk
ATR-based: 1.5-2x Average True Range below entry
Profit Taking
Target 1: 1x range size (take 50% off)
Target 2: 2x range size (take 25% off)
Runner: Trail remaining 25% with moving stops
Specific Entry Techniques
Breakout Entry Methods
Method 1: Immediate Entry
Enter as soon as price closes above/below range
Fastest entry but highest false signal rate
Best for strong momentum situations
Method 2: Pullback Entry
Wait for breakout, then pullback to range level
Enter when price bounces off former resistance/support
Better risk/reward but may miss some moves
Method 3: Volume Confirmation
Wait for breakout + volume spike
Enter after volume confirmation candle
Reduces false signals significantly
Multiple Timeframe Entries
Aggressive: OR5 break → immediate entry
Conservative: OR5 + OR15 + OR30 all align → enter
Balanced: OR15 break with OR30 support → enter
Common Mistakes to Avoid
1. Trading Poor-Quality Ranges
❌ Don't trade ranges that are too narrow or too wide
✅ Focus on clean, well-defined ranges with good volume
2. Ignoring Volume
❌ Don't chase breakouts without volume confirmation
✅ Always check for volume spike on breakouts
3. Over-Trading
❌ Don't force trades when ranges are unclear
✅ Wait for high-probability setups only
4. Poor Risk Management
❌ Don't risk more than planned or use tight stops in volatile conditions
✅ Stick to predetermined risk levels
5. Fighting the Trend
❌ Don't fade breakouts in strongly trending markets
✅ Align trades with overall market direction
Daily Trading Routine
Pre-Market (8:00-9:30 AM)
Check overnight news and earnings
Review major indices (SPY, QQQ, IWM)
Identify potential opening range candidates
Set alerts for range breakouts
Market Open (9:30-10:00 AM)
Watch opening range formation
Note volume and price action quality
Mark key levels on charts
Prepare for breakout signals
Trading Session (10:00 AM - 4:00 PM)
Execute breakout strategies
Manage existing positions
Trail stops as profits develop
Look for additional setups
Post-Market Review
Analyze winning and losing trades
Review range quality vs. outcomes
Identify improvement areas
Prepare for next session
Best Stocks/ETFs for Opening Range Trading
Large Cap Stocks (Best for beginners):
AAPL, MSFT, GOOGL, AMZN, TSLA
High liquidity, predictable behavior
Good range formation most days
ETFs (Consistent patterns):
SPY, QQQ, IWM, XLF, XLE
Excellent liquidity
Clear range boundaries
Mid-Cap Growth (Advanced traders):
Stocks with good volume (1M+ shares daily)
Recent news catalysts
Clean technical patterns
Performance Optimization
Track These Metrics:
Win rate by range type (OR5 vs OR15 vs OR30)
Average R/R (risk vs reward ratio)
Best performing market conditions
Time of day performance
Continuous Improvement:
Keep detailed trade journal
Review failed breakouts for patterns
Adjust position sizing based on win rate
Refine entry timing based on backtesting
Final Tips for Success
Start small - Paper trade or use tiny positions initially
Focus on quality - Better to miss trades than take bad ones
Stay disciplined - Stick to your rules even during losing streaks
Adapt to conditions - What works in trending markets may fail in choppy conditions
Keep learning - Markets evolve, so should your approach
The opening range strategy is powerful because it captures natural market behavior, but like all strategies, it requires practice, discipline, and proper risk management to be profitable long-term.

Katz Exploding PowerBand FilterUnderstanding the Katz Exploding PowerBand Filter (EPBF) v2.4
1. Indicator Overview
The Katz Exploding PowerBand Filter (EPBF) is an advanced technical indicator designed to identify moments of expanding bullish or bearish momentum, often referred to as "power." It operates as a standalone oscillator in a separate pane below the main price chart.
Its primary goal is to measure underlying market strength by calculating custom "Bull" and "Bear" power components. These components are then filtered through a versatile moving average and a dual signal line system to generate clear entry and exit signals. This indicator is not a simple momentum oscillator; it uses a unique calculation based on exponential envelopes of both price and squared price to derive its values.
2. On-Chart Lines and Components
The indicator pane consists of five main lines:
Bullish Component (Thick Green/Blue/Yellow/Gray Line): This is the core of the indicator. It represents the calculated bullish "power" or momentum in the market.
Bright Green: Indicates a strong, active long signal condition.
Blue: Shows the bull component is above the MA filter, but the filter itself is still pointing down—a potential sign of a reversal or weakening downtrend.
Yellow: A warning sign that bullish power is weakening and has fallen below the primary signal lines.
Gray: Represents neutral or insignificant bullish power.
Bearish Component (Thick Red/Purple/Yellow/Gray Line): This line represents the calculated bearish "power" or downward momentum.
Bright Red: Indicates a strong, active short signal condition.
Purple: Shows the bear component is above the MA filter, but the filter itself is still pointing down—a sign of potential trend continuation.
Yellow: A warning sign that bearish power is weakening.
Gray: Represents neutral or insignificant bearish power.
MA Filter (Purple Line): This is the main filter, calculated using the moving average type and length you select in the settings (e.g., HullMA, EMA). The Bull and Bear components are compared against this line to determine the underlying trend bias.
Signal Line 1 (Orange Line): A fast Exponential Moving Average (EMA) of the stronger power component. It acts as the first level of dynamic support or resistance for the power lines.
Signal Line 2 (Lime/Gray Line): A slower EMA that acts as a confirmation filter.
Lime Green: The line turns lime when it is rising and the faster Signal Line 1 is above it, indicating a confirmed bullish trend in momentum.
Gray: Indicates a neutral or bearish momentum trend.
3. On-Chart Symbols and Their Meanings
Various characters are plotted at the bottom of the indicator pane to provide clear, actionable signals.
L (Pre-Long Signal): The first sign of a potential long entry. It appears when the Bullish Component rises and crosses above both signal lines for the first time.
S (Pre-Short Signal): The first sign of a potential short entry. It appears when the Bearish Component rises and crosses above both signal lines for the first time.
▲ (Post-Long Signal): A stronger confirmation for a long entry. It appears with the 'L' signal only if the momentum trend is also confirmed bullish (i.e., the slower Signal Line 2 is lime green).
▼ (Post-Short Signal): A stronger confirmation for a short entry. It appears with the 'S' signal only if the momentum trend is confirmed bullish.
Exit / Take-Profit Symbols:
These symbols appear when a power component crosses below a line, suggesting that momentum is fading and it may be time to take profit.
⚠️ (Exit Signal 1): The Bull/Bear component has crossed below the main MA Filter. This is the first and most sensitive take-profit signal.
☣️ (Exit Signal 2): The Bull/Bear component has crossed below the faster Signal Line 1. This is a moderate take-profit signal.
🚼 (Exit Signal 3): The Bull/Bear component has crossed below the slower Signal Line 2. This is the slowest take-profit signal, suggesting the trend is more definitively exhausted.
4. Trading Strategy and Rules
Long Entry Rules:
Initial Signal: Wait for an L to appear at the bottom of the indicator. This confirms that bullish power is expanding.
Confirmation (Recommended): For a higher-probability trade, wait for a green ▲ symbol to appear. This confirms the underlying momentum trend aligns with the signal.
Entry: Enter a long (buy) position on the opening of the next candle after the signal appears.
Short Entry Rules:
Initial Signal: Wait for an S to appear at the bottom of the indicator. This confirms that bearish power is expanding.
Confirmation (Recommended): For a higher-probability trade, wait for a maroon ▼ symbol to appear. This confirms the underlying momentum trend aligns with the signal.
Entry: Enter a short (sell) position on the opening of the next candle after the signal appears.
Take Profit (TP) Rules:
The indicator provides three levels of take-profit signals. You can choose to exit your entire position or scale out at each level.
For a long trade, exit when you see ⚠️, ☣️, or 🚼 appear below the Bullish Component.
For a short trade, exit when you see ⚠️, ☣️, or 🚼 appear below the Bearish Component.
Stop Loss (SL) Rules:
The indicator does not provide an explicit stop loss. You must use your own risk management rules. Common methods include:
Swing High/Low: For a long position, place your stop loss below the most recent significant swing low on the price chart. For a short position, place it above the most recent swing high.
ATR-Based: Use an Average True Range (ATR) indicator to set a volatility-based stop loss.
Fixed Percentage: Risk a fixed percentage (e.g., 1-2%) of your account on the trade.
5. Disclaimer
This indicator is a tool for technical analysis and should not be considered financial advice. All trading involves significant risk, and past performance is not indicative of future results. The signals generated by this indicator are probabilistic and can result in losing trades. Always use proper risk management, such as setting a stop loss, and never risk more than you are willing to lose. It is recommended to backtest this indicator and use it in conjunction with other forms of analysis before trading with real capital. The indicator should only be used for educational purposes.

Katz Candle Momentum Reversal Indicator v4.1Katz Candle Momentum Reversal Indicator (CMRI) v4.1
Overview
The Katz CMRI is a comprehensive trading indicator designed to identify trend direction, momentum shifts, and potential market reversals. It combines several different concepts into a single, cohesive visual tool.
At its core, the indicator uses a custom Line Break chart calculation to filter out market noise and a Heikin-Ashi-style formula to smooth price action. This combination helps to more clearly define the underlying trend. The main output is a dynamic, multi-colored trend line accompanied by various signals that appear directly on your chart. It's designed to help traders stay with the trend while also spotting key moments of expansion, contraction, and potential reversal.
How to Interpret the Indicator
The indicator has several key visual components:
Main Trend Line: This is the thick, central line that changes color.
Green: Indicates a bullish (upward) trend.
Red: Indicates a bearish (downward) trend.
Faded/Light Colors: Suggest a potential loss of momentum or a pullback within the trend.
White: Signals a significant break in the trend structure.
Trend Cloud: The shaded area between the main trend line and the white midline (mid). A green cloud shows the trend is above the midpoint, while a red cloud shows it's below.
Upper/Lower Bands: The aqua (Trend Up) and yellow (Trend Down) lines represent the recent highs and lows of the established trend. When price is pushing against these bands, it signals trend strength.
Background Colors:
Gray: A "Contraction Zone." This indicates that the trend is losing momentum and consolidating, warning of potential chop or a reversal.
Blue: An "Expansion Event." This highlights a sudden increase in momentum in the direction of the trend.
Signal Shapes:
Diamonds: These are the primary entry signals. A green diamond below a candle signals a potential long entry, while a red diamond above a candle signals a potential short entry.
⬆️⬇️ Arrows: These are secondary momentum signals. They can be used as confirmation that the trend is continuing.
Trading Strategy & Rules
This strategy uses the primary diamond signals for entries and trend changes for exits.
Long Trade (Buy) Rules
Entry: Wait for a green diamond to appear below the price candles. For confirmation, the main trend line should turn solid green, and the price should ideally be above the white midline.
Exit:
Stop Loss: Place a stop loss below the recent swing low or below the candle where the green diamond appeared.
Take Profit: Consider exiting the trade when a red diamond appears above the candles, signaling a potential trend reversal. Alternatively, a trader might exit if the background turns gray (Contraction Zone), indicating the bullish momentum has faded.
Short Trade (Sell) Rules
Entry: Wait for a red diamond to appear above the price candles. For confirmation, the main trend line should turn solid red, and the price should ideally be below the white midline.
Exit:
Stop Loss: Place a stop loss above the recent swing high or above the candle where the red diamond appeared.
Take Profit: Consider exiting the trade when a green diamond appears below the candles. A gray "Contraction Zone" can also serve as an early warning to exit as bearish momentum wanes.
Indicator Filters Explained
The indicator includes a "Trend Filter Type" setting that allows you to adjust its sensitivity. This can help reduce false signals in choppy markets.
Raw: This is the most sensitive setting. It will generate a trend change signal as soon as the basic conditions are met. Use this for scalping or in strongly trending markets, but be aware that it may produce more false signals.
OutStep: This is the default, balanced setting. It adds an extra layer of confirmation by requiring the main trend line itself to be moving in the direction of the new trend. For example, a new green signal will only be confirmed if the trend line's value is higher than its previous value. This helps filter out weak signals.
FullStep: This is the most conservative and filtered setting. It includes the "OutStep" logic and adds further conditions related to the upper and lower trend bands. This setting will produce the fewest signals, but they are generally the highest quality, making it suitable for swing trading or avoiding choppy market conditions.
Disclaimer
This indicator is a tool for technical analysis and should not be considered financial advice. All trading involves substantial risk, including the possible loss of principal. Past performance is not indicative of future results. The signals generated by this indicator are for educational and informational purposes only. You are solely responsible for any trading decisions you make. Use this indicator at your own risk.

Shadow Mimicry🎯 Shadow Mimicry - Institutional Money Flow Indicator
📈 FOLLOW THE SMART MONEY LIKE A SHADOW
Ever wondered when the big players are moving? Shadow Mimicry reveals institutional money flow in real-time, helping retail traders "shadow" the smart money movements that drive market trends.
🔥 WHY SHADOW MIMICRY IS DIFFERENT
Most indicators show you WHAT happened. Shadow Mimicry shows you WHO is acting.
Traditional indicators focus on price movements, but Shadow Mimicry goes deeper - it analyzes the relationship between price positioning and volume to detect when large institutional players are accumulating or distributing positions.
🎯 The Core Philosophy:
When price closes near highs with volume = Institutions buying
When price closes near lows with volume = Institutions selling
When neither occurs = Wait and observe
📊 POWERFUL FEATURES
✨ 3-Zone Visual System
🟢 BUY ZONE (+20 to +100): Institutional accumulation detected
⚫ NEUTRAL ZONE (-20 to +20): Market indecision, wait for clarity
🔴 SELL ZONE (-20 to -100): Institutional distribution detected
🎨 Crystal Clear Visualization
Background Colors: Instantly see market sentiment at a glance
Signal Triangles: Precise entry/exit points when zones are breached
Real-time Status Labels: "BUY ZONE" / "SELL ZONE" / "NEUTRAL"
Smooth, Non-Repainting Signals: No false hope from future data
🔔 Smart Alert System
Buy Signal: When indicator crosses above +20
Sell Signal: When indicator crosses below -20
Custom TradingView notifications keep you informed
🛠️ TECHNICAL SPECIFICATIONS
Algorithm Details:
Base Calculation: Modified Money Flow Index with enhanced volume weighting
Smoothing: EMA-based smoothing eliminates noise while preserving signals
Range: -100 to +100 for consistent scaling across all markets
Timeframe: Works on all timeframes from 1-minute to monthly
Optimized Parameters:
Period (5-50): Default 14 - Perfect balance of sensitivity and reliability
Smoothing (1-10): Default 3 - Reduces false signals while maintaining responsiveness
📚 COMPREHENSIVE TRADING GUIDE
🎯 Entry Strategies
🟢 LONG POSITIONS:
Wait for indicator to cross above +20 (green triangle appears)
Confirm with background turning green
Best entries: Early in uptrends or after pullbacks
Stop loss: Below recent swing low
🔴 SHORT POSITIONS:
Wait for indicator to cross below -20 (red triangle appears)
Confirm with background turning red
Best entries: Early in downtrends or after rallies
Stop loss: Above recent swing high
⚡ Exit Strategies
Profit Taking: When indicator reaches extreme levels (±80)
Stop Loss: When indicator crosses back to neutral zone
Trend Following: Hold positions while in favorable zone
🔄 Risk Management
Never trade against the prevailing trend
Use position sizing based on signal strength
Avoid trading during low volume periods
Wait for clear zone breaks, avoid boundary trades
🎪 MULTI-TIMEFRAME MASTERY
📈 Scalping (1m-5m):
Period: 7-10, Smoothing: 1-2
Quick reversals in Buy/Sell zones
High frequency, smaller targets
📊 Day Trading (15m-1h):
Period: 14 (default), Smoothing: 3
Swing high/low entries
Medium frequency, balanced risk/reward
📉 Swing Trading (4h-1D):
Period: 21-30, Smoothing: 5-7
Trend following approach
Lower frequency, larger targets
💡 PRO TIPS & ADVANCED TECHNIQUES
🔍 Market Context Analysis:
Bull Markets: Focus on buy signals, ignore weak sell signals
Bear Markets: Focus on sell signals, ignore weak buy signals
Sideways Markets: Trade both directions with tight stops
📈 Confirmation Techniques:
Volume Confirmation: Stronger signals occur with above-average volume
Price Action: Look for breaks of key support/resistance levels
Multiple Timeframes: Align signals across different timeframes
⚠️ Common Pitfalls to Avoid:
Don't chase signals in the middle of zones
Avoid trading during major news events
Don't ignore the overall market trend
Never risk more than 2% per trade
🏆 BACKTESTING RESULTS
Tested across 1000+ instruments over 5 years:
Win Rate: 68% on daily timeframe
Average Risk/Reward: 1:2.3
Best Performance: Trending markets (crypto, forex majors)
Drawdown: Maximum 12% during 2022 volatility
Note: Past performance doesn't guarantee future results. Always practice proper risk management.
🎓 LEARNING RESOURCES
📖 Recommended Study:
Books: "Market Wizards" for institutional thinking
Concepts: Volume Price Analysis (VPA)
Psychology: Understanding smart money vs. retail behavior
🔄 Practice Approach:
Demo First: Test on paper trading for 2 weeks
Small Size: Start with minimal position sizes
Journal: Track all trades and signal quality
Refine: Adjust parameters based on your trading style
⚠️ IMPORTANT DISCLAIMERS
🚨 RISK WARNING:
Trading involves substantial risk of loss
Past performance is not indicative of future results
This indicator is a tool, not a guarantee
Always use proper risk management
📋 TERMS OF USE:
For personal trading use only
Redistribution or modification prohibited
No warranty expressed or implied
User assumes all trading risks
💼 NOT FINANCIAL ADVICE:
This indicator is for educational and analytical purposes only. Always consult with qualified financial advisors and trade responsibly.
🛡️ COPYRIGHT & CONTACT
Created by: Luwan (IMTangYuan)
Copyright © 2025. All Rights Reserved.
Follow the shadows, trade with the smart money.
Version 1.0 | Pine Script v5 | Compatible with all TradingView accounts

ML Compressor Enhanced Trading Indicator# 🤖 ML Enhanced Trading Indicator - Advanced Market Analysis
## 📊 Overview
This is a comprehensive Machine Learning Enhanced Trading Indicator that combines multiple advanced analytical techniques to provide high-probability trading signals. The indicator uses artificial intelligence, pattern recognition, anomaly detection, and traditional technical analysis to identify optimal entry and exit points in the market.
## 🚀 Key Features
### 🧠 **Machine Learning Core**
- **Advanced Pattern Recognition**: Uses cosine similarity, Pearson correlation, and Spearman rank correlation to identify historical patterns
- **AI-Powered Predictions**: Implements multiple correlation methods to forecast price movements
- **Anomaly Detection**: Z-score based detection system for unusual market activities
- **Signal Confidence Scoring**: Reliability assessment for each trading signal
### 📈 **Technical Analysis Integration**
- **Multi-Timeframe RSI Analysis**: 14 and 21-period RSI with oversold/overbought detection
- **MACD Momentum**: Enhanced MACD histogram analysis for trend confirmation
- **Bollinger Bands Position**: Dynamic position tracking within BB channels
- **Volume Analysis**: Spike and dry volume detection with ratio calculations
- **Trend Strength Measurement**: EMA-based trend power analysis
### 🎯 **Perfect Zone Detection**
- **Ideal Buy Zone**: Identifies perfect buying opportunities when 7 conditions align:
- ML Score ≥ 0.60
- Bottom proximity detection
- RSI in 20-35 range
- Volume spike confirmation
- Positive price anomaly
- Bullish pattern match
- Positive MACD momentum
### 📊 **Comprehensive Display Table**
- **Real-time ML Analysis**: Complete breakdown of all indicators
- **Perfect Buy Conditions Tracker**: Visual checklist with completion percentage
- **Performance Metrics**: Win rate tracking and P&L analysis
- **Signal Strength Indicators**: Confidence levels for each signal
## 🔧 **Customizable Parameters**
### **ML Settings**
- **ML Lookback Period**: 20-500 bars (default: 100)
- **Anomaly Threshold**: 1.0-5.0 sensitivity (default: 2.0)
- **Pattern Similarity**: 0.5-0.99 matching threshold (default: 0.80)
- **AI Lookback Period**: 20-200 bars (default: 50)
### **AI Prediction Models**
- **Correlation Methods**: Spearman, Pearson, Cosine Similarity
- **Forecast Length**: 15-250 bars (default: 50)
- **Similarity Type**: Price or %Change analysis
### **Visual Options**
- **Table Position**: Top/Bottom Left/Right positioning
- **Table Size**: Small, Normal, Large options
- **Signal Display**: Toggle buy/sell signals on/off
- **AI Visualization**: Optional prediction paths and ZigZag
## 📋 **How to Use**
### **For Beginners**
1. Add the indicator to your chart
2. Look for "PERFECT BUY" signals in the table
3. Wait for completion percentage ≥ 85% for highest probability trades
4. Use the background color changes as visual confirmation
### **For Advanced Traders**
1. Analyze individual ML components in the detailed table
2. Monitor anomaly detection for unusual market conditions
3. Use pattern confidence levels for trade timing
4. Combine with your existing strategy for confirmation
### **Signal Interpretation**
- **🟢 PERFECT BUY**: All 7 conditions met - highest probability reversal
- **🟡 NEAR BOTTOM**: Close to ideal conditions - monitor closely
- **🔴 NOT READY**: Wait for better setup
- **Strong Buy/Sell Signals**: ML score-based entries with high confidence
## ⚠️ **Important Notes**
### **Risk Management**
- This indicator provides analysis and signals, not guaranteed outcomes
- Always use proper risk management and position sizing
- Consider market conditions and fundamental factors
- Backtest the strategy on your preferred timeframes and assets
### **Best Practices**
- Use multiple timeframe analysis for confirmation
- Combine with support/resistance levels
- Monitor volume confirmation for all signals
- Set appropriate stop-losses and profit targets
### **Performance Tracking**
- The indicator tracks its own performance with win rate calculations
- Monitor the "AI Prediction" accuracy percentage
- Use the P&L tracking to assess signal quality over time
## 🔄 **Updates and Improvements**
This indicator is continuously evolving with:
- Enhanced machine learning algorithms
- Improved pattern recognition capabilities
- Additional correlation methods for better accuracy
- Performance optimization for faster calculations
- New visualization features based on user feedback
## 📚 **Technical Details**
### **Machine Learning Implementation**
- **Pattern Matching**: 20-bar normalized price patterns with historical comparison
- **Correlation Analysis**: Mathematical similarity scoring between current and historical patterns
- **Anomaly Detection**: Statistical Z-score analysis across price, volume, and RSI
- **Signal Weighting**: Multi-factor scoring system with optimized weights
### **Algorithm Components**
1. **Feature Extraction**: Price, volume, momentum, volatility, and trend features
2. **Pattern Recognition**: Historical pattern database with similarity matching
3. **Anomaly Detection**: Multi-dimensional Z-score threshold analysis
4. **Signal Generation**: Weighted scoring system with confidence intervals
5. **Performance Tracking**: Real-time win rate and accuracy monitoring
### **Calculation Methods**
- **Trend Strength**: (EMA8 - EMA21) / EMA21 * 100
- **Volume Ratio**: Current Volume / 20-period SMA Volume
- **BB Position**: (Close - BB_Lower) / (BB_Upper - BB_Lower)
- **Anomaly Score**: Average of normalized Z-scores for price, volume, and RSI
## 🎨 **Visual Elements**
### **Background Colors**
- **Light Green**: Perfect buy zone detected
- **Light Red**: Perfect sell zone detected
- **Light Blue**: Near bottom proximity
- **Green/Red Transparency**: Price anomaly detection
### **Signal Shapes**
- **Green Triangle Up**: Strong buy signal
- **Red Triangle Down**: Strong sell signal
- **Aqua Diamond**: Perfect buy zone entry
- **Purple Diamond**: Perfect sell zone entry
### **Table Information**
- **ML Complete Analysis**: 16 comprehensive metrics
- **Perfect Buy Conditions**: 7-point checklist with status indicators
- **Real-time Values**: Live updating of all calculations
- **Color-coded Status**: Green (good), Yellow (moderate), Red (caution)
## 🔍 **Troubleshooting**
### **Common Issues**
- **Table Not Showing**: Enable "Show ML Table" in settings
- **No Signals Appearing**: Check "Show Buy/Sell Signals" option
- **Performance Issues**: Reduce ML Lookback Period for faster calculation
- **Too Many/Few Signals**: Adjust Anomaly Threshold sensitivity
### **Optimization Tips**
- **For Day Trading**: Use lower timeframes (1m, 5m, 15m) with reduced lookback periods
- **For Swing Trading**: Use higher timeframes (1h, 4h, 1D) with standard settings
- **For Scalping**: Enable only strong signals and reduce pattern similarity threshold
- **For Long-term**: Increase all lookback periods and use daily/weekly timeframes
## 📖 **Disclaimer**
This indicator is for educational and informational purposes only. It should not be considered as financial advice. Trading involves substantial risk of loss and is not suitable for all investors. Past performance does not guarantee future results.
### **Risk Warning**
- All trading involves risk of substantial losses
- Never risk more than you can afford to lose
- This indicator does not guarantee profitable trades
- Always use proper risk management techniques
- Consider consulting with a financial advisor
### **Liability**
The creator of this indicator is not responsible for any losses incurred from its use. Users should thoroughly test and understand the indicator before using it with real money.
### **Feature Requests**
- Suggest improvements through TradingView comments
- Report bugs with detailed descriptions
- Share successful strategies using the indicator
- Contribute to community discussions
## 🏆 **Credits and Acknowledgments**
This indicator builds upon various open-source libraries and mathematical concepts:
- TradingView ZigZag library for visualization
- Statistical correlation methods from academic research
- Machine learning concepts adapted for financial markets
- Community feedback and testing contributions
## 📈 **Performance Metrics**
The indicator includes built-in performance tracking:
- **Win Rate Calculation**: Percentage of profitable signals
- **Signal Accuracy**: ML prediction vs actual price movement
- **Drawdown Tracking**: Current unrealized P&L from last signal
- **Completion Percentage**: How many perfect conditions are met
## 🔬 **Mathematical Foundation**
### **Correlation Calculations**
- **Pearson**: Measures linear correlation between patterns
- **Spearman**: Rank-based correlation for non-linear relationships
- **Cosine Similarity**: Vector-based similarity for pattern matching
### **Statistical Methods**
- **Z-Score**: (Value - Mean) / Standard Deviation
- **Pattern Normalization**: Price / Price
- **Volatility Percentile**: Historical ranking of current volatility
- **Momentum Calculation**: Price change over multiple periods
## 🎯 **Trading Strategies**
### **Conservative Approach**
- Wait for Perfect Buy Zone (85%+ completion)
- Use higher timeframes for confirmation
- Set stop-loss at recent swing low
- Take profits at resistance levels
### **Aggressive Approach**
- Trade on Strong Buy/Sell signals
- Use lower completion thresholds (70%+)
- Tighter stop-losses with faster exits
- Higher position sizes with confirmed trends
### **Hybrid Strategy**
- Combine with other indicators for confirmation
- Use different settings for different market conditions
- Scale in/out based on signal strength
- Adjust parameters based on market volatility

ICT Smart Money Trading Suite [SwissAlgo]ICT/Smart Money Trading Suite - Technical Analysis Indicator
----------------------------------------------------------
OVERVIEW
The ICT/Smart Money Trading Suite is a technical analysis indicator that implements concepts from Inner Circle Trader (ICT) methodology and Smart Money Concepts (SMC).
ICT methodology was developed by Michael J. Huddleston (ICT) and focuses on understanding Institutional market behavior.
Smart Money Concepts builds upon these ideas to analyze how large Financial Institutions and/or Market Makers seem to operate in the markets.
This indicator combines multiple analytical tools into a single package for market structure analysis, imbalance detection, and the observation of institutional order flow.
----------------------------------------------------------
CORE COMPONENTS
Market Structure Analysis:
- External Structure : Major swing highs and lows that define broader price movement (these are the most significant structural points that institutions reference for their positioning and typically require substantial volume and momentum to break)
- Internal Structure : Shorter-term pivots showing micro-trend developments within the External Structure (these internal pivot highs and lows often represent areas where retail traders may be positioned on the wrong side of the market as they frequently form just before major structural breaks or trend continuations, creating liquidity that institutions can utilize)
- Structural Breakout Detection : Identification of structure breaks and potential trend changes ( 'Change of Character' which occurs when the External Structure shifts from bullish to bearish bias or vice-versa indicating a potential major trend reversal, and 'Break of Structure' which happens when price decisively takes out previous significant highs in a bearish trend or previous significant lows in a bullish trend confirming trend continuation or acceleration)
- EMA Cloud : Dynamic support and resistance zones with trend context (additional reference point)
Imbalance Zone Detection:
Fair Value Gaps (FVGs):
Price inefficiencies that occur between candles when sudden price moves create gaps in price delivery
Typically formed when the low of a bullish candle is higher than the high of the candle two periods prior, or when the high of a bearish candle is lower than the low of the candle two periods prior
These gaps represent areas where price moved too quickly without adequate two-way auction process
Institutions may return to fill these inefficiencies at a later time for proper price discovery
The theory suggests that all price ranges should eventually be traded through to complete the auction process
Gaps are automatically removed from the chart when price fully retraces back through the inefficient area
Order Blocks (OBs):
Specific candles that occur immediately before significant market moves and represent institutional decision points
Identified as the last opposing candle before a strong directional move (final bearish candle before major bullish move or final bullish candle before major bearish move)
These candles contain the orders and liquidity that institutions used as a foundation for their market manipulation
Represent areas where large institutional players positioned themselves to move the market significantly
Price may return to these levels to collect additional liquidity or test institutional resolve
The candle's full range (high to low) is considered the active zone where institutional interest may remain
Vector Candle Recovery:
Zones created by high-activity candles that demonstrate unusually large range and volume characteristics
These candles are interpreted as manipulative price pushes designed to hunt liquidity and trigger stop losses
Often used by institutions to induce retail traders into poor positions before reversing direction
Recovery zones represent the full range of these vector candles where price may retrace
The concept assumes that extreme moves often get partially retraced as the market corrects from artificial price displacement
Zones are invalidated when a significant portion of the vector candle range is retraced (typically 50% or more)
Support & Resistance:
Key price zones based on historical price reactions and pivot clustering analysis
Calculated through algorithmic identification of areas where price has repeatedly found buyers (support) or sellers (resistance)
Strength is determined by the number of times price has reacted from these levels and the volume of activity at these zones
Represent psychological and algorithmic reference points where institutional systems are likely to place orders
Create areas of increased probability for price reactions due to concentration of pending orders and decision-making activity
Zones are color-coded based on current price position: green for support (price above), red for resistance (price below), yellow for neutral (price within)
Liquidity Analysis:
- Liquidity Pools : Areas above or below key levels where stop orders may cluster
- Kill Zones : Time-based periods associated with increased market activity
- Daily/Weekly/Monthly Price Levels : Key institutional reference points (price highs/lows)
Vector Candles/Price Manipulation:
Advanced algorithm identifying statistically significant candles using volume delta analysis, range statistics, and persistence scoring.
----------------------------------------------------------
VISUAL INTERPRETATION - DETAILED GUIDE
MARKET STRUCTURE
External Structure (Thick Lines):
- Green thick lines: Major support levels (external lows) that define bullish structure
- Red thick lines: Major resistance levels (external highs) that define bearish structure
- These lines represent significant swing points that institutions may reference
- Lines extend from the swing point and update as the structure evolves
Internal Structure (Thin Lines):
- Green thin lines: Minor support levels showing internal market structure
- Red thin lines: Minor resistance levels showing internal market structure
- More frequent updates than external structure, showing micro-trend changes
Structure Markers:
- Small triangles with "H": External pivot highs (major resistance points)
- Small triangles with "L": External pivot lows (major support points)
- Small dots: Internal pivot points (minor structure without text)
- Markers appear with a 20-bar delay to confirm pivot validity
HIGHS/LOWS LEVELS
Daily Levels (Green Dashed Lines):
- Horizontal dashed lines marking the previous day's high and low
- Updates at the start of each new trading day
- Gradient effect shows historical importance (newer = more opaque)
- Acts as institutional reference points for intraday trading
Weekly Levels (White Dashed Lines):
- Horizontal dashed lines marking the previous week's high and low
- Updates at the start of each new trading week
- Typically more significant than daily levels for swing trading
- Often respected by institutional algorithms
Monthly Levels (Orange Dashed Lines):
- Horizontal dashed lines marking the previous month's high and low
- Updates at the start of each new trading month
- Highest significance levels for long-term institutional positioning
- Major psychological and algorithmic reference points
VECTOR CANDLES
Candle Body Coloring System:
- Lime Green Bodies: Ultra-bullish vector candles (Z-score ≥ 3.0)
- Blue Bodies: Abnormal bullish vector candles (Z-score 2.0-2.99)
- Bright Red Bodies: Ultra-bearish vector candles (Z-score ≥ 3.0)
- Purple Bodies: Abnormal bearish vector candles (Z-score 2.0-2.99)
- Faded Green/Red: Normal market activity candles
Vector Identification Criteria:
- Statistical significance based on range and volume delta
- Persistence scoring (how much directional pressure remained)
- ATR-based absolute detection (candles >2x ATR automatically qualify)
- These candles often precede significant market moves or reversals
EMA CLOUD
Purple Cloud Visualization:
- Central line: 50-period EMA (blue line)
- Upper boundary: EMA + dynamic standard deviation band
- Lower boundary: EMA - dynamic standard deviation band
- Cloud fill: Purple semi-transparent area between boundaries
Interpretation:
- Price above cloud: Bullish bias context
- Price below cloud: Bearish bias context
- Price within cloud: Neutral/transitional zone
- Cloud thickness adapts to market volatility automatically
KILL ZONES
Background Highlighting:
- Yellow background tint during active kill zone periods
- London Session: 08:00-11:00 (UTC+1 time)
- NY Open: 13:00-16:00 (UTC+1 time)
- NY Close: 19:00-21:00 (UTC+1 time)
- Times automatically adjust to the chart timezone
Purpose:
- Highlights periods of typically increased institutional activity
- Times when liquidity hunting and manipulation often occur
- Periods when significant directional moves frequently begin
IMBALANCE ZONES - DETAILED BREAKDOWN
Fair Value Gaps (FVGs):
- Green boxes: Bullish FVGs (gap between bear candle high and bull candle low)
- Red boxes: Bearish FVGs (gap between bull candle high and bear candle low)
- Gray dotted lines: Midpoint of each gap (50% retracement level)
- Text label: "Fair Value Gap" in top-right corner
- Auto-removal: Boxes disappear when the price fills the gap
Order Blocks (OBs):
- Green boxes: Bullish order blocks (demand zones from the last bear candle before bullish vector)
- Red boxes: Bearish order blocks (supply zones from the last bull candle before the bearish vector)
- Gray dotted lines: Midpoint of each order block
- Text label: "OB" in top-right corner
- Invalidation: Boxes removed when price breaks below (bull OB) or above (bear OB)
Vector Candles Recovery Zones:
- Green boxes: Recovery zones after bullish vector candles
- Red boxes: Recovery zones after bearish vector candles
- Gray dotted lines: Midpoint of the vector candle range
- Text label: "Vector Recovery" on the right side
- These mark the full range of significant vector candles where retracements may occur
Support & Resistance Zones:
- Green boxes: Support zones (price currently above the zone)
- Red boxes: Resistance zones (price currently below the zone)
- Yellow boxes: Neutral zones (price within the zone)
- Text labels: "Support", "Resistance", or "Support/Resistance"
- Based on historical pivot clustering and strength analysis
Liquidity Pools:
- Green boxes: Bullish liquidity pools (below recent lows where buy stops cluster)
- Red boxes: Bearish liquidity pools (above recent highs where sell stops cluster)
- Gray dotted lines: Key liquidity level within the pool
- Text label: "Liquidity Pool" on the right side
- Zones where institutional players may hunt stop losses before reversing
----------------------------------------------------------
CALCULATION METHODOLOGY
Vector Candle Algorithm:
- Statistical Analysis using 48-bar lookback period
- Z-score thresholds: 2.0 (abnormal), 3.0 (ultra)
- ATR-based significance filtering
- Volume Delta Integration with lower timeframe analysis
- Persistence scoring based on directional pressure sustainability
- Combined scoring system (delta + range)
- Absolute Vector Detection for candles exceeding 2x ATR
Market Structure Parameters:
- Swing Size: 20-period pivot detection
- Breakout Threshold: 3 consecutive breaks for structure confirmation
- EMA Length: 50-period with dynamic cloud sizing
Fair Value Gap Detection:
- Auto Threshold: Dynamic gap sizing based on asset volatility
- Manual Threshold: User-defined minimum gap percentage
- Mitigation Logic: Automatic removal when price fills gaps
----------------------------------------------------------
TARGET USERS
This indicator is designed for traders who:
- Study Inner Circle Trader concepts
- Apply Smart Money Concepts in their analysis
- Focus on market structure and institutional behavior
- Seek confluence-based trading approaches
- Use higher timeframe bias for decision making
Experience Level: Intermediate to Advanced
Requires understanding of market structure concepts and institutional trading theory.
Recommended Timeframes:
- Analysis: 4H, Daily for market structure context
- Execution: 1H, 15min for entry timing
- Lower timeframes: With higher timeframe alignment
----------------------------------------------------------
CUSTOMIZATION OPTIONS
Display Controls:
- Master toggle for all imbalance zones
- Individual controls for each concept type
- Market structure line visibility
- Kill zone highlighting
- EMA cloud display
Visual Settings:
- Automatic light/dark mode color adaptation
- Adjustable zone transparency levels
- Extension distance controls
- Descriptive text labels
Technical Parameters:
- Vector candle sensitivity thresholds
- Historical analysis lookback periods
- Maximum zone display limits
- Zone invalidation conditions
----------------------------------------------------------
EDUCATIONAL BACKGROUND
Inner Circle Trader (ICT): A trading methodology developed by Michael J. Huddleston that focuses on understanding how institutional traders and market makers operate. The approach emphasizes market structure, liquidity concepts, and timing based on institutional behavior patterns.
Smart Money Concepts (SMC): An evolution of ICT principles that analyzes how large financial institutions move markets. These concepts include order blocks, fair value gaps, liquidity hunting, and market structure shifts.
Both methodologies are based on the premise that understanding institutional trading behavior can provide insights into market direction and timing.
----------------------------------------------------------
IMPORTANT DISCLAIMERS
This indicator is provided for educational and analytical purposes only. It is not financial advice and does not guarantee trading results.
Trading involves substantial risk of loss. Past performance does not indicate future results. Users should thoroughly understand the underlying concepts before applying them to live trading.
The effectiveness of these analytical methods may vary across different market conditions, timeframes, and instruments. Proper risk management and additional analysis are essential.
This indicator is a tool for market analysis, not a complete trading system. Success requires understanding of market principles, risk management, and continuous learning.
Always test analytical approaches thoroughly using historical data and demo accounts before implementing with real capital.

Position Size Calculator with Fees# Position Size Calculator with Portfolio Management - Manual
## Overview
The Position Size Calculator with Portfolio Management is an advanced Pine Script indicator designed to help traders calculate optimal position sizes based on their total portfolio value and risk management strategy. This tool automatically calculates your risk amount based on portfolio allocation percentages and determines the exact position size needed while accounting for trading fees.
## Key Features
- **Portfolio-Based Risk Management**: Calculates risk based on total portfolio value
- **Tiered Risk Allocation**: Separates trading allocation from total portfolio
- **Automatic Trade Direction Detection**: Determines long/short based on entry vs stop loss
- **Fee Integration**: Accounts for trading fees in position size calculations
- **Risk Factor Adjustment**: Allows scaling of position size up or down
- **Visual Display**: Shows all calculations in a clear, color-coded table
- **Automatic Risk Calculation**: No need to manually input risk amount
## Input Parameters
### Total Portfolio ($)
- **Purpose**: The total value of your investment portfolio
- **Default**: 0.0
- **Range**: Any positive value
- **Step**: 0.01
- **Example**: If your total portfolio is worth $100,000, enter 100000
### Trading Portfolio Allocation (%)
- **Purpose**: The percentage of your total portfolio allocated to active trading
- **Default**: 20.0%
- **Range**: 0.0% to 100.0%
- **Step**: 0.01
- **Example**: If you allocate 20% of your portfolio to trading, enter 20
### Risk from Trading (%)
- **Purpose**: The percentage of your trading allocation you're willing to risk per trade
- **Default**: 0.1%
- **Range**: Any positive value
- **Step**: 0.01
- **Example**: If you risk 0.1% of your trading allocation per trade, enter 0.1
### Entry Price ($)
- **Purpose**: The price at which you plan to enter the trade
- **Default**: 0.0
- **Range**: Any positive value
- **Step**: 0.01
### Stop Loss ($)
- **Purpose**: The price at which you will exit if the trade goes against you
- **Default**: 0.0
- **Range**: Any positive value
- **Step**: 0.01
### Risk Factor
- **Purpose**: A multiplier to scale your position size up or down
- **Default**: 1.0 (no scaling)
- **Range**: 0.0 to 10.0
- **Step**: 0.1
- **Examples**:
- 1.0 = Normal position size
- 2.0 = Double the position size
- 0.5 = Half the position size
### Fee (%)
- **Purpose**: The percentage fee charged per transaction
- **Default**: 0.01% (0.01)
- **Range**: 0.0% to 1.0%
- **Step**: 0.001
## How Risk Amount is Calculated
The script automatically calculates your risk amount using this formula:
```
Risk Amount = Total Portfolio × Trading Allocation (%) × Risk % ÷ 10,000
```
### Example Calculation:
- Total Portfolio: $100,000
- Trading Allocation: 20%
- Risk per Trade: 0.1%
**Risk Amount = $100,000 × 20 × 0.1 ÷ 10,000 = $20**
This means you would risk $20 per trade, which is 0.1% of your $20,000 trading allocation.
## Portfolio Structure Example
Let's say you have a $100,000 portfolio:
### Allocation Structure:
- **Total Portfolio**: $100,000
- **Trading Allocation (20%)**: $20,000
- **Long-term Investments (80%)**: $80,000
### Risk Management:
- **Risk per Trade (0.1% of trading)**: $20
- **Maximum trades at risk**: Could theoretically have 1,000 trades before risking entire trading allocation
## How Position Size is Calculated
### Trade Direction Detection
- **Long Trade**: Entry price > Stop loss price
- **Short Trade**: Entry price < Stop loss price
### Position Size Formulas
#### For Long Trades:
```
Position Size = -Risk Factor × Risk Amount / (Stop Loss × (1 - Fee) - Entry Price × (1 + Fee))
```
#### For Short Trades:
```
Position Size = -Risk Factor × Risk Amount / (Entry Price × (1 - Fee) - Stop Loss × (1 + Fee))
```
## Output Display
The indicator displays a comprehensive table with color-coded sections:
### Portfolio Information (Light Blue Background)
- **Portfolio (USD)**: Your total portfolio value
- **Trading Portfolio Allocation (%)**: Percentage allocated to trading
- **Risk as % of Trading**: Risk percentage per trade
### Trade Setup (Gray Background)
- **Entry Price**: Your specified entry price
- **Stop Loss**: Your specified stop loss price
- **Fee (%)**: Trading fee percentage
- **Risk Factor**: Position size multiplier
### Risk Analysis (Red Background)
- **Risk Amount**: Automatically calculated dollar risk
- **Effective Entry**: Actual entry cost including fees
- **Effective Exit**: Actual exit value including fees
- **Expected Loss**: Calculated loss if stop loss is hit
- **Deviation from Risk %**: Accuracy of risk calculation
### Final Result (Blue Background)
- **Position Size**: Number of shares/units to trade
## Usage Examples
### Example 1: Conservative Long Trade
- **Total Portfolio**: $50,000
- **Trading Allocation**: 15%
- **Risk per Trade**: 0.05%
- **Entry Price**: $25.00
- **Stop Loss**: $24.00
- **Risk Factor**: 1.0
- **Fee**: 0.01%
**Calculated Risk Amount**: $50,000 × 15% × 0.05% ÷ 100 = $3.75
### Example 2: Aggressive Short Trade
- **Total Portfolio**: $200,000
- **Trading Allocation**: 30%
- **Risk per Trade**: 0.2%
- **Entry Price**: $150.00
- **Stop Loss**: $155.00
- **Risk Factor**: 2.0
- **Fee**: 0.01%
**Calculated Risk Amount**: $200,000 × 30% × 0.2% ÷ 100 = $120
**Actual Risk**: $120 × 2.0 = $240 (due to risk factor)
## Color Coding System
- **Green/Red Header**: Trade direction (Long/Short)
- **Light Blue**: Portfolio management parameters
- **Gray**: Trade setup parameters
- **Red**: Risk-related calculations and results
- **Blue**: Final position size result
## Best Practices
### Portfolio Management
1. **Keep trading allocation reasonable** (typically 10-30% of total portfolio)
2. **Use conservative risk percentages** (0.05-0.2% per trade)
3. **Don't risk more than you can afford to lose**
### Risk Management
1. **Start with small risk factors** (1.0 or less) until comfortable
2. **Monitor your total exposure** across all open positions
3. **Adjust risk based on market conditions**
### Trade Execution
1. **Always validate calculations** before placing trades
2. **Account for slippage** in volatile markets
3. **Consider position size relative to liquidity**
## Risk Management Guidelines
### Conservative Approach
- Trading Allocation: 10-20%
- Risk per Trade: 0.05-0.1%
- Risk Factor: 0.5-1.0
### Moderate Approach
- Trading Allocation: 20-30%
- Risk per Trade: 0.1-0.15%
- Risk Factor: 1.0-1.5
### Aggressive Approach
- Trading Allocation: 30-40%
- Risk per Trade: 0.15-0.25%
- Risk Factor: 1.5-2.0
## Troubleshooting
### Common Issues
1. **Position Size shows 0**
- Verify all portfolio inputs are greater than 0
- Check that entry price differs from stop loss
- Ensure calculated risk amount is positive
2. **Very small position sizes**
- Increase risk percentage or risk factor
- Check if your risk amount is too small for the price difference
3. **Large risk deviation**
- Normal for very small positions
- Consider adjusting entry/stop loss levels
### Validation Checklist
- Total portfolio value is realistic
- Trading allocation percentage makes sense
- Risk percentage is conservative
- Entry and stop loss prices are valid
- Trade direction matches your intention
## Advanced Features
### Risk Factor Usage
- **Scaling up**: Use risk factors > 1.0 for high-confidence trades
- **Scaling down**: Use risk factors < 1.0 for uncertain trades
- **Never exceed**: Risk factors that would risk more than your comfort level
### Multiple Timeframe Analysis
- Use different risk factors for different timeframes
- Consider correlation between positions
- Adjust trading allocation based on market conditions
## Disclaimer
This tool is for educational and planning purposes only. Always verify calculations manually and consider market conditions, liquidity, and correlation between positions. The automated risk calculation assumes you're comfortable with the mathematical relationship between portfolio allocation and individual trade risk. Past performance doesn't guarantee future results, and all trading involves risk of loss.

Lot Size Calculator (SL Percentage) - Futures ⚠️ IMPORTANT DISCLAIMER
This indicator is provided for educational and informational purposes only. The author assumes no responsibility for any financial losses, code errors, calculation mistakes, or trading decisions based on this tool. Use at your own risk and responsibility. Always manually verify calculations before opening real positions.
Contract size calculations are based on standard full-size futures contracts, not micro contracts (even though micro contracts are supported for identification).
Description
Money management tool for automatic calculation of optimal contract size (lot size) in futures trading. Supports over 50 futures instruments with pre-configured tick sizes and pip values for CME and other exchanges.
Supported Instruments
Currency Futures: 6J, 6E, 6B, 6A, 6C, 6S, 6N
Index Futures: ES, NQ, YM, RTY, MES, MNQ, MYM, M2K, NKD
Energy: CL, NG, HO, RB, QM
Metals: GC, SI, HG, MGC, SIL
Agricultural: ZC, ZS, ZW, HE, LE, ZO, ZR, ZM, ZL
Interest Rates: ZN, ZB, ZT, ZF
Crypto: MBT, MET
Others: VX
Main Parameters
Equity : Total available capital
Risk : Maximum risk percentage per trade
Stop Loss : Percentage distance of stop loss
Risk/Reward Ratio: Ratio to calculate take profit
Entry Price: Entry price (0 = current price)
Stop Loss Modes
Percentage Stop Loss (Use SL in % = ON):
Automatically calculates SL level as percentage from entry price
Example: Entry 100, SL 2% → Long SL at 98, Short SL at 102
Manual Stop Loss (Use SL in % = OFF):
Enter exact stop loss price directly
Greater precision for specific technical levels (support/resistance)
Interactive feature: You can drag the red stop loss line directly on the chart to modify the level in real-time
How to Use
Set equity and risk % according to your trading plan
Choose direction (Long/Short) and stop loss (percentage or price)
Enter entry price (optional)
Read the CONTRACT SIZE in the green table
Verify levels Entry/SL/TP on the graphic lines
Output
Information table with all parameters and highlighted CONTRACT SIZE
Graphic lines: Entry (blue), Stop Loss (red), Take Profit (green)
Configurable alerts with calculated values
Advantages
✅ Automatic calculation of optimal size
✅ Precise tick sizes for each instrument
✅ Systematic risk management
✅ Clear visual interface
✅ Multi-asset support on futures
Warnings
⚠️ Always verify that the instrument is recognized (no orange warning)
⚠️ Manually check calculations before trading
⚠️ Test in demo before using with real money
⚠️ Update regularly for any contract modifications
⚠️ DISCLAIMER IMPORTANTE
Questo indicatore è fornito esclusivamente a scopo educativo e informativo. L'autore non si assume alcuna responsabilità per eventuali perdite finanziarie, errori nel codice, calcoli errati o decisioni di trading basate su questo strumento. L'utilizzo è a proprio rischio e responsabilità. Si raccomanda di verificare sempre manualmente i calcoli prima di aprire posizioni reali.
I calcoli della dimensione del contratto sono basati su contratti futures standard full-size, non micro contratti (anche se i micro contratti sono supportati per l'identificazione).
Descrizione
Strumento di money management per il calcolo automatico della dimensione ottimale del contratto (lot size) nel trading di futures. Supporta oltre 50 strumenti futures con tick size e pip value pre-configurati per mercati CME e altri exchange.
Strumenti Supportati
Currency Futures: 6J, 6E, 6B, 6A, 6C, 6S, 6N
Index Futures: ES, NQ, YM, RTY, MES, MNQ, MYM, M2K, NKD
Energy: CL, NG, HO, RB, QM
Metals: GC, SI, HG, MGC, SIL
Agricultural: ZC, ZS, ZW, HE, LE, ZO, ZR, ZM, ZL
Interest Rates: ZN, ZB, ZT, ZF
Crypto: MBT, MET
Altri: VX
Parametri Principali
Equity : Capitale totale disponibile
Risk : Percentuale massima di rischio per trade
Stop Loss : Distanza percentuale dello stop loss
Risk/Reward Ratio: Rapporto per calcolare il take profit
Entry Price: Prezzo di entrata (0 = prezzo corrente)
Modalità Stop Loss
Stop Loss Percentuale (Use SL in % = ON):
Calcola automaticamente il livello SL come percentuale dal prezzo di entrata
Esempio: Entry 100, SL 2% → SL Long a 98, SL Short a 102
Stop Loss Manuale (Use SL in % = OFF):
Inserisci direttamente il prezzo esatto dello stop loss
Maggiore precisione per livelli tecnici specifici (supporti/resistenze)
Funzione interattiva: Puoi trascinare direttamente la linea rossa dello stop loss sul grafico per modificare il livello in tempo reale
Come Usare
Imposta equity e risk % secondo il tuo piano di trading
Scegli direzione (Long/Short) e stop loss (percentuale o prezzo)
Inserisci entry price (opzionale)
Leggi il CONTRACT SIZE nella tabella verde
Verifica i livelli Entry/SL/TP sulle linee grafiche
Output
Tabella informativa con tutti i parametri e il CONTRACT SIZE evidenziato
Linee grafiche: Entry (blu), Stop Loss (rosso), Take Profit (verde)
Alert configurabile con i valori calcolati
Vantaggi
✅ Calcolo automatico della size ottimale
✅ Tick size precisi per ogni strumento
✅ Risk management sistematico
✅ Interfaccia visiva chiara
✅ Supporto multi-asset su futures
Avvertenze
⚠️ Verifica sempre che lo strumento sia riconosciuto (no warning arancione)
⚠️ Controlla manualmente i calcoli prima di tradare
⚠️ Testa in demo prima dell'uso con denaro reale
⚠️ Aggiorna regolarmente per eventuali modifiche ai contratti